Download
1 / 32
320 likes | 339 Views
Learn about survey questions, variable types, data classification, bar charts, Pareto diagrams, and stem-and-leaf plots. Discover key steps in constructing a stem-and-leaf diagram and analyzing histograms. Interpret student weight data and back-to-back displays. Engage in practical data analysis and visualization techniques.

E N D
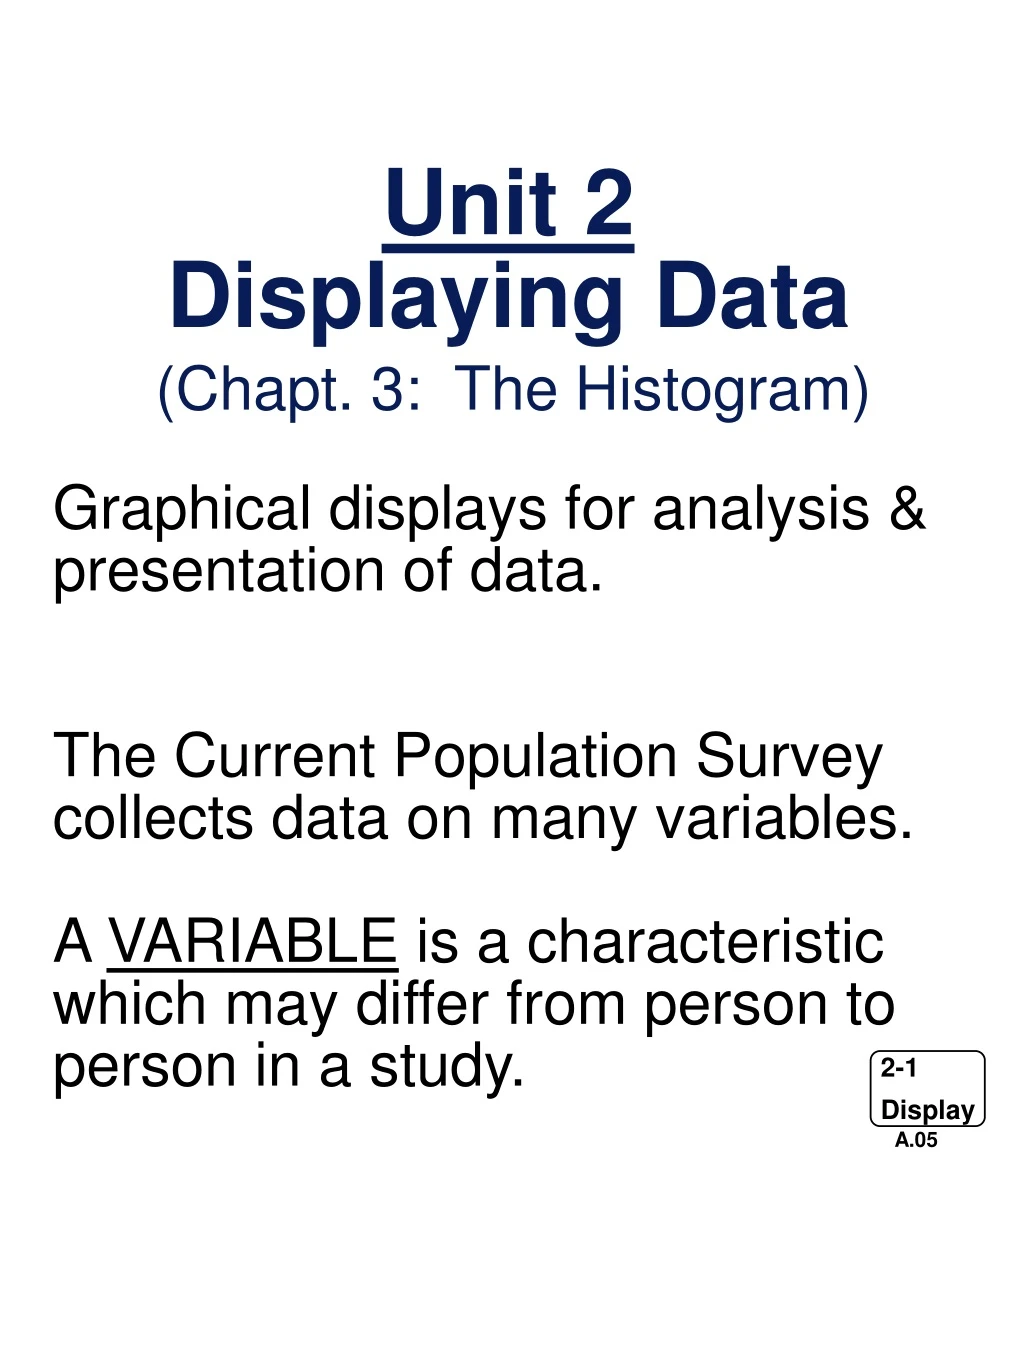
Unit 2 Displaying Data (Chapt. 3: The Histogram) Graphical displays for analysis & presentation of data. The Current Population Survey collects data on many variables. A VARIABLE is a characteristic which may differ from person to person in a study. A.05
Some Survey Questions Question asked Corresponding Variable in a survey . Variable . type . • How old are you? • How many people in your family? • Are you currently married? • How many rooms in your house? • How tall are you? • What is your major? • Where were you born? • How much do you like chocolate? very much / somewhat / so-so / not much / not at all
Variables and data can be: qualitative - the answer to the question is not a number quantitative - the answer to the question is a number qualitative data can be: - discrete - takes on particular values only - continuous - can be measured in arbitrarily small amounts Another classification system: nominal - categorical ordinal - values fall in ordered categories, may be numerical interval - can be ordered AND we can indicate an exact distance between values Variable types
Qualitative includes ________ and ________ data types. Quantitative includes ________ and ________ data types.
CORPORATIONMARKET SHARE (%) Coca-Cola Co. 38.6 Pepsico Inc. 27.4 Dr Pepper Co. 7.1 Seven-Up Co. 6.3 RJR Nabisco 4.6 Royal Crown Cola Co. 3.5 Others 12.5 Pie chart & Bar chart
Soft Drinks Revisited N a DP Pe Co Oth 7U RC
The (frequency) Pareto Diagram is a bar chart which displays the causes of various defects, in order, from most to least frequent so that you can focus attention on the most important problems. The Pareto Diagram
Park Nicollet Pareto diagram with listing of Possible Causes for Patient Dissatisfaction National Demonstration Project
( Consumer Reports ) Hot Dogs
(1) Scan the data for approximate range. Choose a suitable pair of adjacent digits (eg. tens and ones). (2) Allocate a separate line in the display for each possible string of leading digits (STEM). (3) Split each data value between the selected two digits. (4) Write down the trailing digit(s) (LEAF) for each data value on the line corresponding to its leading digits. Sort the leaves. Provide a relevant key. Steps in ConstructingA Stem-and-Leaf Diagram
Data from 25 subjects in a survey case # age sex marital status # children husb.educ.level wife educ.level --------- ----- ----- ------------------- ------------ --------------------- --------------------- 1 70 M married 3 h.s. grad h.s. grad 2 28 F separated 3 h.s. grad college grad 3 47 M married 1 h.s. grad h.s. grad 4 48 M married 3 college grad college grad 5 23 M married 0 college grad h.s. grad 6 69 F divorced 3 - - grad 8th grade 7 31 F married 1 some grad work Master's degree 8 70 F single 0 - - h.s. grad 9 80 F widowed 0 - - less than 8th grade 10 37 F married 3 h.s. grad some h.s. 11 65 F single 0 - - some h.s. 12 71 F widowed 2 - - some h.s. 13 41 F married 3 h.s. grad h.s. grad 14 70 M married 5 some h.s. less than 8th grade 15 56 F married 1 grad 8th grade grad 8th grade 16 34 F married 4 some h.s. grad 8th grade 17 48 F married 6 h.s. grad some h.s. 18 43 F divorced 3 - - college grad 19 50 F married 1 h.s. grad some h.s. 20 24 F married 2 college grad college grad 21 23 M married 1 college grad college grad 22 47 F married 4 PhD degree PhD degree 23 63 M single 0 h.s. grad - - 24 31 F married 4 college grad h.s. grad 25 21 F separated 3 some h.s. some h.s. Stem - & -Leaf diagram
STEM AND LEAF PLOT OF AGE, N = 25 MINIMUM IS: 21.0 LOWER HINGE IS: 31.0 MEDIAN IS: 47.0 UPPER HINGE IS: 65.0 MAXIMUM IS: 80.0 2 1 3 3 4 8 3H 1 1 4 7 4M 1 3 7 7 8 8 5 0 6 6H 3 5 9 7 0 0 0 1 8 0 Stem-&-Leaf of Ages
(FPP) In a histogram, the areas of the blocks represent percentages. In a histogram, the area of each block represents the percentage of observations in the corresponding interval. Age Data - Histogram 7 0.25 6 0.20 5 4 0.15 3 0.10 2 0.05 1 20 50 80 110 AGE 7 0.25 6 0.20 5 4 0.15 3 0.10 2 0.05 1 20 50 80 110 AGE
1. Look at the shape. Is it symmetric? skewed? 2. Detect outliers, if any. 3. Where is the average? What to Look for in a Histogram
Basic Shapes of Histograms Normal, Triangular, Symmetric Uniform, Rectangular Skewed to left Skewed to right Bimodal J-shaped
Student 1 2 3 4 5 6 7 8 9 10 Male/Female F M F M M F F M M F Weight 98 150 108 158 162 112 118 167 170 120 Student 11 12 13 14 15 16 17 18 19 20 Male/Female M M M F F M F M M F Weight 177 186 191 128 135 195 137 205 190 120 Student 21 22 23 24 25 26 27 28 29 30 Male/Female M M F M F F M M M M Weight 188 176 118 168 115 115 162 157 154 148 Student 31 32 33 34 35 36 37 38 39 40 Male/Female F M M F M F M F M M Weight 101 143 145 108 155 110 154 116 161 165 Student 41 42 43 44 45 46 47 48 49 50 Male/Female F M F M M F F M M M Weight 142 184 120 170 195 132 129 215 176 183 Weights of 50 college students (in pounds) Back-to-Back Displays
8 09 8 8 1 10 8 8 6 5 5 2 0 11 9 8 0 0 0 12 7 5 2 13 14 2 3 5 8 15 0 4 4 5 7 8 16 1 2 2 5 7 8 17 0 0 6 6 7 18 3 4 6 8 19 0 1 5 5 20 5 21 5 Back-to-Back Displays - 2 Stem-&-Leaf Diagram 09 8 10 1 8 8 11 0 2 5 5 6 8 8 12 0 0 0 8 9 13 2 5 7 14 2 3 5 8 15 0 4 4 5 7 8 16 1 2 2 5 7 8 17 0 0 6 6 7 18 3 4 6 8 19 0 1 5 5 20 5 21 5 FEMALE MALE Back-to-Back Stem-&-Leaf Diagram
Time Series Plots Time in seconds 160 140 120 100 80 60 40 20 Day 5 10 15 20 25 30 35 40 45 50 55 Average Time for Receptionist to Answer Telephones Between 9:00 and 10:00 a.m. (Park Nicollet Project)
The (frequency) Pareto Diagram is a bar chart which displays the causes of various defects, in order, from most to least frequent so that you can focus attention on the most important problems. The Pareto Diagram
Wooden glass doors are produced on a six day work week. At final checkout before shipping, the doors are inspected and each is classified as conforming or nonconforming. Nonconforming doors are further classified into one of the following categories, according to their defect. The data here give the number of defective doors by day and by classification. A Pareto chart can be made to show which type of defect is most prevalent. Pareto Diagram Day: Day inspected Window: Window misaligned Discolor: Discolor Handle: Handle hole missing Hinges: Hinges wrong Rough: Rough wood Glass: Broken glass Warped: Warped Variables are: Day Window Discolor Handle Hinges Rough Glass Warped
Day Window Discolor Handle Hinges Rough Glass Warped 1 1 3 2 7 1 4 2 2 2 3 3 3 2 1 4 4 1 4 2 3 3 1 1 1 1 5 1 2 6 2 2 4 1 1 8 1 1 9 1 10 2 11 5 12 1 1 4 4 1 13 1 15 2 16 2 17 2 18 1 19 6 20 3 2 22 2 1 23 3 24 1 2 1 25 2 2 3 2 1 2 26 1 2 3 4 27 2 3 1 29 1 30 2 31 5 Total 6 24 24 47 24 12 14 Pareto Charts
Frequency Pareto Chart 50 40 Count 30 20 10 Hinge Color Wood Hole Warp Glass Window Problem
A Pareto Diagram can be made to display the costs of various defects, in order, so that you can focus attention on the most important problems. The following costs can be assumed for each of the defect types. Pareto Charts - 2 Day: Day Inspected Window: Window misaligned $10.00 Discolor: Discolor 5.00 Handle: Handle hole missing 3.00 Hinges: Hinges wrong 6.00 Rough: Rough wood 5.00 Glass: Broken glass 8.00 Warped: Warped 45.00
Cost Pareto Chart 600 500 400 cost ($) 300 200 100 Warp Hinge Color Wood Glass Hole Window Problem