Download
1 / 31
310 likes | 375 Views
Explore the unique features and impacts of climate change on phytoplankton biodiversity in the Arabian Sea. Analysis of monsoon winds, seasonal variability, and phytoplankton biomass. Discover the implications on the ecosystem and biodiversity.

E N D
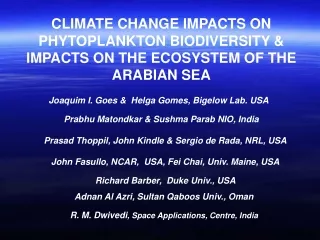
CLIMATE CHANGE IMPACTS ON PHYTOPLANKTON BIODIVERSITY & IMPACTS ON THE ECOSYSTEM OF THE ARABIAN SEA Joaquim I. Goes & Helga Gomes, Bigelow Lab. USA Prabhu Matondkar & Sushma Parab NIO, India Prasad Thoppil, John Kindle & Sergio de Rada, NRL, USA John Fasullo, NCAR, USA, Fei Chai, Univ. Maine, USA Richard Barber, Duke Univ., USA Adnan Al Azri, Sultan Qaboos Univ., Oman R. M. Dwivedi, Space Applications, Centre, India
UNIQUE FEATURES OF THE ARABIAN SEA Is a tropical sea and the northwestern landlocked arm of the Indian Ocean Comes under the influence of the monsoon winds which reverse their direction seasonally driving one the most energetic current systems and the greatest seasonal variability of phytoplankton biomass
Reversal of the winds and their intensity is strongly regulated by thermal gradient between land and sea
HIGH LOW 0.1 0.5 1.0 2.0 5.0 10.0 20.0 WINTER MONSOON Schematic showing snow cover extent and wind direction superimposed on an ocean color chlorophyll image for the northeast monsoon season (Nov-Feb).
LOW HIGH 0.1 0.5 1.0 2.0 5.0 10.0 20.0 SUMMER MONSOON Schematic showing the reversal in wind direction during the southwest monsoon (Jun-Sept), superimposed on satellite derived chlorophyll fields
HIGHER ALBEDO LOWER ALBEDO MORE SNOW WEAKER LAND SEA PRESSURE GRADIENT LESS SNOW STRONGER LAND SEA PRESSURE GRADIENT LESS PHYTO WEAKER SW MONSOON WINDS STRONGER SW MONSOON WINDS SEA COLDER LANDMASS WEAKER UPWELLING SEA WARMER LANDMASS Schematic showing the SW Monsoon response of the Arabian Sea to snow cover over the Himalayan-Tibetan Plateau
SW Eurasian-Land Warming Warming of SW Eurasia mirrors the global-land signal, but recent warming anomalies are >50% larger than global temperature trends.
Trend line showing anomalies (departures from monthly means) of snow cover extent over Southwest Asia and Himalayas-Tibetan Plateau between 1967 and 2003.
70 years of global warming?: Photograph of the Pindari glacier in the Himalayas taken on October 7, 1936, by then Deputy Conservator of Forests F W Champion. 70 years later at the exact spot, his grandson James Champion photographed the same glacier. (Source Sunday Indian Express, 29th Dec. 2006).
Interannual changes in chlorophyll along coast of Somalia since 1997 (Goes et al., Science, 2005 )
Sept. 1997 Sept. 2006 Oman Oman India India SeaWiFS derived chlorophyll fields during the peak southwest monsoon growth season of 1997 and 2006
OMAN OMZ SOMALIA 0.1 0.5 1.0 2.0 5.0 10.0 20.0 The Arabian Sea’s permanent oxygen minimum zone
NORTHEAST MONSOON MORE SNOW COLDER AND DRIER WINDS (E>P)_ SEA COLDER LANDMASS STRONGER CONVECTIVE MIXING MORE PHYTO LESS SNOW WARMER AND HUMID WINDS SEA WARMER LANDMASS LESS PHYTO WEAKER CONVECTIVE MIXING
Air-temperature and Relative humidity for the northern Arabian Sea (60°E-70°E, 14°N-25°N).
Annual trends of net heat flux (NCEP-NCAR) (60-70°E, 14°N-25°N) and Mixed Layer Depth (XBT, JEDAC, USA)
Observed and model-derived MLD for winter (Jan – Feb), and model derived Sea Surface Salinity (SSS, psu) during Jan – May for the 60°E-70°E, 14°N-25°N. Model derived fields are obtained from the ECCO-JPL Kalman Filter Assimilation project.
WAS EAS Winter mean SeaWiFS Chl a averaged over the Eastern Arabian Sea (EAS, 66°E-70°E, 15°N-24°N) and in the western Arabian Sea (WAS, 55°E-62°E, 17.5°N-22.5°N).
High chlorophyll concentrations during the NEM are being caused by blooms of dinoflagellate Noctiluca miliaris
CHARACTERISTICS OF ARABIAN SEA NOCTILUCA MILIARIS BLOOMS Noctiluca is a heterotrophic dinoflagellate containing a green endosymbiont “Pedinomonas noctilucae” Its appearance in bloom proportions during the NEM is unprecedented as no reports of blooms of this organism during Int. Arabian Sea JGOFS 1992 to 1996 or from Int. Indian Ocean Expeditions of the 1960’s. Noctiluca appears to have replaced diatoms as the major bloom forming phytoplankton of the NEM. It occurs in (cold) <22oC, nutrient rich and oxygen poor waters
Weekly SeaWiFS and MODIS/Aqua Level-3 merged Chl a images with Sea Surface Height anomalies and geostrophic velocity vectors from TOPEX/POSEIDON and ERS-2 Gomes et al. (2008) Deep-Sea Research
20th Feb 2008 OMAN
Precipitable water from SSM/I for June showing particularly strong postive and pervasive trends in the Arabian Sea (John Fasullo NCAR)
OUTSTANDING QUESTIONS FOR THE ARABIAN SEA Is the appearance of N. miliaris blooms the result of climate change or natural variability? What are the long-term impact of this possible change in phytoplankton biodiversity and biological productivity on: • Carbon delivery to deeper layers of the Arabian Sea • Bacterial processes • Denitrification rates • The Oxygen Minimum Zone and • Increased storm activity • Coastal Fisheries
INDIAN OCEAN CIRCULATION MODEL (John Kindle & Sergio deRada) • 1/8-degree NCOM (Navy Coastal Ocean Model) • 30S to 30N, 30.5 to 121.5E • Mercator grid (~13km), 40 Levels σ/z • Boundary and initial conditions from Global NCOM • 0.5-degree NOGAPS Atmospheric forcing • MODAS: Full 3D Temperature and Salinity relaxation • Initial simulation for 2007
Carbon, Silicate, Nitrogen Ecosystem Model (CoSiNE) Chai et al. 2002; Dugdale et al. 2002 Air-Sea Exchange Small Phytoplankton [P1] Micro- Zooplankton [Z1] Biological Uptake Total CO2 [TCO2] Grazing NO3 Uptake NH4 Uptake Predation Nitrate [NO3] Iron Excretion Meso- zooplankton [Z2] Ammonium [NH4] N-Uptake Fecal Pellet Advection & Mixing Iron Grazing Fecal Pellet Diatoms [P2] Lost Iron Detritus-N [DN] Detritus-Si [DSi] Si-Uptake Sinking Silicate [Si(OH)4] Physical Model Dissolution Sinking Sinking Chai et al., 1996; 2003
30th Sept 2006 30th Sept 2006 SEAWIFS MODEL
“Nothing in the sea falls haphazard; if we cannot predict, it is because we do not know the cause, or how the cause works..." Henry Bryant Bigelow
ACKNOWLEDGEMENTS This work is being funded by NASA Oceans and Ice & NASA Biodiversity and Ecosystem Programs. We are thankful to the National Institute of Oceanography and the Indian Space Research Organization for supporting ship observations. Special thanks to Woody Turner and Paula Bontempi for their support