Bivariate Regression
250 likes | 437 Views
Bivariate Regression. Political Participation. Political Contestation. Bivariate Regression. Rule of Law. Political Participation. Trivariate Regression. Rule of Law. Political Participation. Political Contestation. Crosstab: Contestation and Participation.

Bivariate Regression
E N D
Presentation Transcript
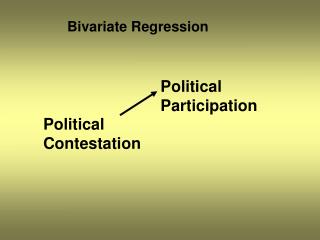
Bivariate Regression Political Participation Political Contestation
Bivariate Regression Rule of Law Political Participation
Trivariate Regression Rule of Law Political Participation Political Contestation
Crosstab: Contestation and Participation Note: Variables are continuous, but grouped by quantiles for purposes of exposition.
Correlation: Contestation and Participation
Bivariate Regression: Contestation and Participation
Crosstab: Rule of Law and Participation Note: Variables are continuous, but grouped by quantiles for purposes of exposition.
Crosstab: Participation and Contestation controlling for Rule of Law Contestation (quantiles) Participation (quantiles)
Correlation: Participation and Contestation, Controlling for Rule of Law
Crosstab: Presidential Vote (2008) and Liberalism, controlling for Presidential Vote (2004) Rule of Law Participation
Correlation: Participation and Rule of Law, Controlling for Contestation
Explaining Venn Diagrams Variance Participation
Explaining Venn Diagrams Variance Contestation
Explaining Venn Diagrams Variance Rule of Law
Pearson r = .83 Rule of Law Contestation Pearson r = .90 Participation Contestation Participation Pearson r = .91 Rule of Law
Participation Rule of Law Contestation
Multivariate Regression: Participation, controlling for Contestation and Rule of Law
Appendix: Syntax R Code: library(foreign) #Choose the file `class_qog.dta' myFile <- file.choose() dat <- read.dta(myFile,header=TRUE) attach(dat) q <- quantile(dat$cam_contest, c(0, .25, .50, .75, 1), na.rm=T) contestq <- cut(dat$cam_contest, q, include.lowest=T) levels(contestq) <- c("1st", "2nd", "3rd", "4th") q <- quantile(dat$bti_pp, c(0, .25, .50, .75, 1), na.rm=T) dat$ppq <- cut(dat$bti_pp, q, include.lowest=T) levels(dat$ppq) <- c("1st", "2nd", "3rd", "4th") q <- quantile(dat$bti_rol, c(0, .25, .50, .75, 1), na.rm=T) dat$rolq <- cut(dat$bti_rol, q, include.lowest=T) levels(dat$rolq) <- c("1st", "2nd", "3rd", "4th") attach(dat) #Making the crosstabs table .Table <- xtabs(~ppq+contestq, data=dat) .Table #Correlation Tables cor(dat[,c("bti_pp","cam_contest")], use="complete.obs") cor(dat[,c("bti_pp","cam_contest")], use="complete.obs", method="spearman") mod<-lm(bti_pp~cam_contest, data=dat) #I did not standardize the coefficients, but that can be done like this: sdev.cont<-sd(cam_contest, na.rm=T) sdev.part<-sd(bti_pp, na.rm=T) std.b.cont <- mod$coefficients[2] * (sdev.cont / sdev.part) scatterplot(fh_polity2~cam_contest | rolq, reg.line=lm, smooth=TRUE, ylab="Democracy (Polity) Score", xlab="Level of Contestation", main="Contestation and Democracy \n (by rule of law quantiles)", spread=TRUE, boxplots='xy', span=0.5, by.groups=TRUE, data=dat) #Participation and Rule of Law #Making the crosstabs table .Table <- xtabs(~ppq+rolq, data=dat) .Table #Correlation Tables cor(dat[,c("bti_pp","bti_rol")], use="complete.obs") cor(dat[,c("bti_pp","bti_rol")], use="complete.obs", method="spearman") .Table1 <- xtabs(~ppq+rolq+contestq, data=dat) .Table1 .Table2 <- xtabs(~ppq+contestq+rolq, data=dat) .Table2 cor(dat[,c("bti_pp","bti_rol", "cam_contest")], use="complete.obs") cor(dat[,c("bti_pp","bti_rol", "cam_contest")], use="complete.obs", method="spearman") xyplot(bti_pp~cam_contest | rolq, pch=16, ylab="Participation", xlab="Contestation", main="Participation and Contestation \n by Rule of Law Quantiles", auto.key=list(border=TRUE), par.settings = simpleTheme(pch=16), scales=list(x=list(relation='same'), y=list(relation='same')), data=dat) xyplot(bti_pp ~ bti_rol | contestq, pch=16, ylab="Participation", xlab="Rule of Law", main="Participation and Rule of Law \n by Contestation Quantiles", auto.key=list(border=TRUE), par.settings = simpleTheme(pch=16), scales=list(x=list(relation='same'), y=list(relation='same')), data=dat) #Putting them together #Plot 1 par(mfrow=c(1,2)) scatterplot(bti_pp~cam_contest | rolq, reg.line=lm, smooth=TRUE, ylab="Participation", xlab="Level of Contestation", main="Participation and Contesation \n (by rule of law quantiles)", spread=TRUE, boxplots='xy', span=0.5, by.groups=TRUE, data=dat) #Plot 2 scatterplot(bti_pp~bti_rol | contestq, reg.line=lm, smooth=TRUE, ylab="Participation", xlab="Rule of Law", main="Participation and Rule of Law \n (by Contestation quantiles)", spread=TRUE, boxplots='xy', span=0.5, by.groups=TRUE, data=dat) #Positive Relationship [code omitted - uses a different dataset] #Negative Relationship scatterplot(wdi_mort~log(gle_gdp) , reg.line=lm, smooth=TRUE, ylab="Infant Mortality", xlab="GDP Per Capita(logged)", main="Infant Mortality and GDP", col="black", spread=TRUE, boxplots='xy', span=0.5, by.groups=TRUE, data=dat) #Insignificant Relationship [code omitted - uses different dataset] #Linear Regression summary(lm(bti_pp~cam_contest+bti_rol)) Stata Code: tabulate ppq contestq2, cchi2 chi2 column cor bti_pp cam_contest cam_contest reg bti_pp cam_contest twoway (lfitci bti_pp cam_contest) (scatter bti_pp cam_contest) tabulate ppq rolq, cchi2 chi2 column cor bti_pp bti_rol cam_contest reg bti_pp bti_rol twoway (lfitci bti_pp cam_contest) (scatter Bti_pp cam_contest) by rolq2, sort : tabulate ppq contestq2, cchi2 chi2 column by contestq, sort: tabulate ppq rolq, cchi2 chi2 column cor bti_pp cam_contest bti_rol twoway (lfitci bti_pp cam_contest) (scatter bti_pp cam_contest), by(rolq2) twoway (lfitci bti_pp bti_rol) (scatter bti_pp bti_rol), by(contestq)