Download
1 / 16
160 likes | 281 Views
ANNEX A - CQC Performance, Quarter 2, 2012 Section 1 – Scorecard summary Slide 2 Section 2 – delivery priority 1: Deliver and Improve our regulatory and other functions Slides 3 – 8 Section 3 – delivery priority 3: Manage our organisation, people and resources Slides 9 – 10

E N D
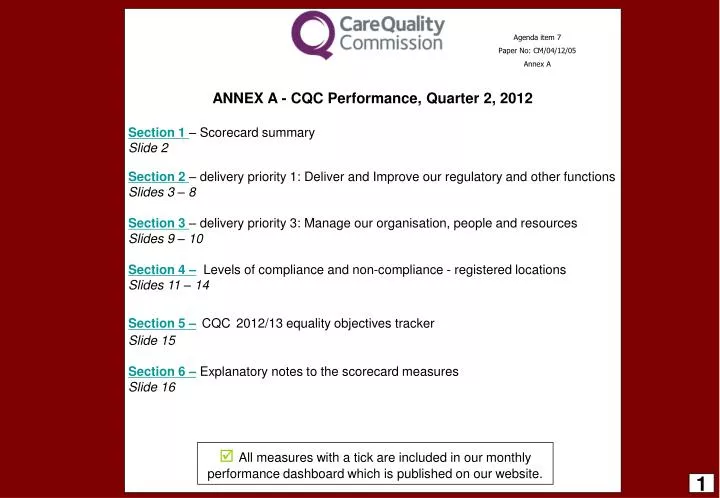
ANNEX A - CQC Performance, Quarter 2, 2012 Section 1– Scorecard summary Slide 2 Section 2– delivery priority 1: Deliver and Improve our regulatory and other functions Slides 3 – 8 Section 3– delivery priority 3: Manage our organisation, people and resources Slides 9 – 10 Section 4–Levels of compliance and non-compliance - registered locations Slides 11 – 14 Section 5 –CQC2012/13 equality objectives tracker Slide 15 Section 6 –Explanatory notes to the scorecard measures Slide 16 Agenda item 7 Paper No: CM/04/12/05 Annex A All measures with a tick are included in our monthly performance dashboard which is published on our website. 1
Q2 & YTDscorecard summary Operating performance - Compliance inspections Operating performance - Registration, Enforcement and MHA Customer Service Resources and audit actions 2
CQC Performance - Q2, 2012– section 2, Deliver and Improve our regulatory and other functions Priority 1 – Deliver and improve our regulatory and other functions: Strengthen and improve the effectiveness and consistency of the regulatory model – Compliance, Enforcement and Registration Commentary: In Q2 Operations reviewed and rebaselined all of the targets with regions to take account for performance in Q1 and planned increases in capacity in Q3 and Q4. Based on this, as of Q2 delivery of the programme was on track for dentist locations and broadly on track for NHS and ASC. IHC was an outlier in performance achieving 14% of plan against a Q2 target 17%. Private ambulance inspections are also under plan and will require a significant uplift of activity in the second half of the year to meet plan. There are over 100 new compliance inspectors that will complete training and begin inspections in Q3 and Q4, which has been included in planning for the remainder of the year. Additional actions to increase activity include overtime and the recruitment of temporary healthcare professional staff in support of the programme. The trajectory on the left is based on 5 weeks performance to mid October, it should be noted that this is considered worst possible projection, and that based on full year performance inspection activity has increased at an average of 15% per month. Latest position of inspection activity The table below demonstrates the most recent inspection performance information as at 1 November. Overall there have been 12,292 inspections or just over 38% of the planned programme for the year. At 671 inspections in the week this was the highest weekly number of inspections this year, it is also the fourth consecutive week were inspection activity has been around the 600 mark, significantly above the average weekly performance of 396. The increase is largely due to the deployment of new compliance inspectors and the use of overtime by the regions. Although October performance has been notable, meeting the annual inspection programme plan will be challenging, there is 40% of the financial year remaining in which time the remaining 60% of the target is to be achieved. 1 This is the profiled target to date the annual target is given numerically in the cells to the left 3
CQC Performance - Q2, 2012– section 2, Deliver and Improve our regulatory and other functions Priority 1 – Deliver and improve our regulatory and other functions: Strengthen and improve the effectiveness and consistency of the regulatory model – Compliance, Enforcement and Registration Commentary: The regulatory Committee has agreed to 3 thematic reviews this year covering: Dementia, Experiences of people waiting for NHS treatment and physical health needs of people with a learning disability. The review of dementia started in September and is due to report in December, the remaining reviews are planned and are on track to report in March 2013. The number of QRP items is 40,451this is an increase of more than almost 20% or 7,000 since May of this year. Although draft and final report timeliness has improved in comparison to the same period last year (which in Q2 2011/12 was 47% and 54% respectively) it remains below plan for this year. The graphs below demonstrate that the plan was only met once and that performance for final reports in particular has a negative trend. Release 19 of CRM will provide details at a regional and team level for draft and final report timeliness, this will be reported to compliance managers to drive performance through management actions. This is being monitored weekly. Target 90% Target 90% 4
CQC Performance - Q2, 2012– section 2, Deliver and Improve our regulatory and other functions Priority 1 – Deliver and improve our regulatory and other functions: Strengthen and improve the effectiveness and consistency of the regulatory model – Compliance, Enforcement and Registration Commentary: There was a marginal increase in the number of warning notices in Q2 to 189 compared with 184 in Q1. This is more than double the same period last year when a total of 196 warning notices were served. The percentage of warning notices that are issued within 14 days of identifying one is required has remained fairly constant between Q1 and Q2 at 79.9% and 78.1% respectively, and 80.6% year to date. Of 840 locations that have de-registered since the beginning of the year, 21 have done so following CQC intervention. 5
CQC Performance - Q2, 2012– section 2, Deliver and Improve our regulatory and other functions Priority 1 – Deliver and improve our regulatory and other functions: Strengthen and improve the effectiveness and consistency of the regulatory model – Compliance, Enforcement and Registration Commentary: New provider and manager applications completed within 8 weeks remains within plan at 87.6% year to date and within the threshold to be rated as green (i.e 5% within target). Meeting the 4week target for variation applications remains challenging. The graph below illustrates the weekly performance over the last 16 weeks, although performance has improved on average in the last 6 weeks it remains significantly below target. To improve performance Operations have made additions to release 19 of CRM; this will provide data on those cases which are delayed at the request of, or due to, the provider. This information can then be used to assess where management actions can be targeted to improve performance and what is due to circumstances beyond the control of the CQC. Regionally the North, Central and London are performing broadly consistently at around 80%, however the South has a high number of complex registrations and sales of locations, meaning that some cases are registered but then delayed by the provider. This is being monitored by Operations and the new data will drive actions to improve performance. The percentage of applications rejected increased slightly in Q2, this was identified as being due to new guidance, which has since been reissued with minor amendments. To date performance has been strong, particularly compared to last year when the rejection rate was between 35% and 45%. 6
CQC Performance - Q2, 2012– section 2, Deliver and Improve our regulatory and other functions Priority 1 – Deliver and improve our regulatory and other functions: Strengthen and improve the effectiveness and consistency of the regulatory model - Other inspections and mental health Mental Health Act Operations: Planned MHA Commissioner visits remain ahead of the schedule for the year to date - against a planned programme of 530 inspections in the first 6 months of the year, 598 have been completed. All complaint targets are also on track, of 296 complaints about providers in Q1 and Q2, 290 were triaged within 3 working days and 295 were responded to within 25 days. Mental Health Act Operations improvement programme: Several key milestones aimed at improving delivery of the Mental Health Act Operations have been achieved year to date. An induction programme for 20 new Commissioners will be delivered in November and a further induction programme is on track for 30 new SOADs starting in December. The increase in our available ‘pool’ of Commissioners and SOADs will allow the Commission to act more responsively to peaks in demand. Requests for SOADs moved from a paper based process to an online request form aimed at improving timeliness and reducing errors, as of September manual requests were not being accepted, the MHA team have been communicating with individual locations and have reduced the number of manual responses to less than 10% in under 2 months with weekly reductions. In line with other directorates all initial call and post is now handled by the NCSC and from November complaints call handling will also move to the NCSC. MHA has been closely involved with the strategic review team to ensure that the MHA strategy is integral to the CQC strategy and operations are further aligned. Following the introduction of the online form, SOAD measures covering medication, ECT, and CTO visits will be available from Q3 onwards. 7
CQC Performance - Q2, 2012– section 2, Deliver and Improve our regulatory and other functions Priority 1 – Deliver and improve our regulatory and other functions: Strengthen and improve the effectiveness and consistency of the regulatory model – Information and publication NCSC call handling and quality There have been almost 97,000 calls to the NCSC in the first 6 months of the year, and all handling targets have been met. In April the NCSC signed up with a nationally recognised performance improvement programme for call centres which benchmarks service and quality standards against other organisation’s UK call centres. The NCSC came 36th with a customer service score of 86%. Most other first-time entrants scored around 40%. This achievement is one year ahead of plan and the position ahead of expectations. The detail from the final report will be used to identify improvements to customer service with a view to incorporating benchmarks into the work of the NCSC. Whistleblowing A two week sampling exercise of whistle blowing enquires to identify trends, themes and outcomes was completed in October and a summary is included in the covering paper to this scorecard. Provider sentiment tracking Our second six monthly provider sentiment survey was carried out in September, this is part of wider sentiment tracking and the response rate and results have been very positive. The online questionnaire was sent to all registered providers and there were over 3,500 responses, which is approximately 10% of all providers and from a good mix of services and sectors. The survey focuses on our model of regulation and approach to inspection. The response to this question ‘providers feel informed about CQC and have the information they need to be regulated by us’ (P3) shows a small improvement (93.5% positive in March compared to 95.6% positive response in September). A full breakdown of responses by sector will be presented to the December meeting of the Board. Specific findings and areas of improvement will be shared with Operations and other directorates as well as providers. Publications, web and communication Year to date there have been almost 2.7m visits to our website of which almost 1.7m were unique visits. The ‘information for the public’ section of our website has been the most visited area in the first 6 months of the year. The most popular pages of the public section of the site are the provider profiles; of which there have been almost 2m pages viewed since April. Information and guidance for the organisations we regulate is the next most visited area; guidance about compliance has been the most downloaded item, at almost 50,000 to date. Our monthly e-newsletter has almost 31,000 subscribers. 8
CQC Performance - Q2, 2012– section 3, Manage our organisation, people and resources Priority 3 – Manage our organisation, people and resources Vacancies and establishment: As of 26 October there were 833 compliance inspectors in post, compared with the full year planned establishment of 955. The vacancy rate has fallen from 25% in April to under 8% at the end of September. In addition to the current 833 in post there are 82 confirmed new inspectors with induction dates in one of five remaining induction programmes between 15th October and 7th January. There are 7 regionally confirmed vacancies, (all in the South). Recruitment of intelligence and policy managers as well as the Director of Health Watch England is ongoing with all appointments at interview or offer stage. CQC establishment currently stands at 2,296 compared with 1,971 for the same period last year. Turnover and sickness rate Turnover decreased marginally in Q2 from 2% in Q1 to 1.8% and year to date stands at 3.7%. The sickness rate also declined to 3.2% compared with 3.6% in Q1, however the overall illness rate has marginally increased compared with the same period last year, the illness rate in Q1 2011/12 was 2.6% in Q1 and 3.6% in Q2. The graph below illustrates the quarterly sickness rate for each of the last 6 quarters. 1 Actual performance is the most recent fortnight reported, therefore not an average 2 The rolling year average ( Sept 2011- Sept 2012) for Turnover is 7.2%and 4% for the sickness rate 3 The annual target is 96%, the monthly target is cumulative and 8% per month 9
CQC Performance - Q2, 2012– section 3, Manage our organisation, people and resources Priority 3 – Manage our organisation, people and resources (and Governance) Complaint handling Year to date there have been 201 stage one complaints, this is a significant decrease compared to the same period last year, when there were 291 stage one complaints received. The majority of complaints were from members of the public and service users. The number of stage 1 complaints proceeding to stage 2 increased in Q2 to 27%, the complaints team have reviewed this and are satisfied that the increase is not related to complaint handling at stage 1 but instead an increase in the number of complainants asking for a review. Following improvements to the complaint handling process all complaints in Q2 were closed within 20 working days compared with 67% in Q1, at the current average performance, 95% of all complaints will be handled within target for the full year meeting the annual business target. Statutory requests for information There have been almost 600 requests for statutory information in the first 6 months of the year. 572 or 96.5% were completed within the statutory deadlines. The majority, 422, were freedom of information requests. There were 65 data protection Act requests and 82 information sharing requests. All measures are on track to achieved their 2012/13 business plan targets. Audit actions In the first 5 months of the year there were 308 audit actions raised, of these 303 were due to be completed by the end of August. Of the outstanding audit actions the majority relate to safeguarding and whistle blowing (21 actions of 43 in progress) and knowledge and information management (11 actions of 43 outstanding). Revenue expenditure Year to date revenue expenditure shows an under spend of £6.4m (excluding fee income or 8%) consisting of staff costs of £5.0m, Non Staff Costs of £0.1m, depreciation of £1.3m. The under spend has remained at an average of 8% year to date. 1 This figure is correct as of the last reported update in respect of year to date performance to August 10
CQC Performance –Q2, 2012– section 4, levels of compliance and non compliance at registered locations Number of locations in each sector that meet essential standards of quality and safety By sector – location level CQC Performance – April - June, Q1, 2012– compliance outcomes The graph to the left illustrates levels of compliance across all sectors. As at the end of Q2 there were 17,292 compliant locations compared with 13,218 in Q1. 19,683 locations have not yet had an inspection (compared with 23,306 in Q1) and 4,411 were non compliant with at least one outcome, (compared with 4,117 in Q1). Year to date there have been 373 warning notices issued to non compliant locations, 21 locations have de-registered following intervention by the CQC and there have been 5 urgent suspension of registration ,or urgent variation or imposition of conditions using Section 31 powers. 11
CQC Performance – Q2, 2012– section 4, compliance outcomes Levels of compliance and non-compliance - registered locations NHS locations non-compliant with one or more outcomes, by age Non compliance is broken down by sector and period. On the table on the left, the column ‘Q4 2011/12’ demonstrates the number that were non compliant by age at the end of that quarter. The row ‘less than one quarter’ shows that there were 34 non compliant NHS locations at the end of Q4, tracking this group by following the arrow shows that the number of these that were non compliant fell in Q1 2012/13 to 29 and then again to 14 in Q2 2012/13. The graph illustrates the total number of locations that were non compliant in each quarter. There has been a decrease in total non compliant locations in each of the last three quarters, there were 128 in Q4 2011/12, 116 in Q1 of this year and 112 in Q2. Importantly there has been a notable decrease in aged NHS non compliance, locations that were non compliant for any period over two quarters represented 50% and 57% of the total non compliant locations in Q4 and Q1 respectively, at the end of Q2 this figure had fallen to 31% This data includes locations consistently non-compliant with a single outcome and locations that were non-compliant at the beginning of several quarters but with different outcomes. Some of the latter group may have returned to compliance during a quarter, only to become non-compliant again by the time the data is captured at the beginning of the next quarter.Further analysis is being undertaken to review the movements in compliance, evaluate the effectiveness of actions, non compliance across outcomes and the variation across sectors. 12
CQC Performance – Q2, 2012– section 4, compliance outcomes Levels of compliance and non-compliance - registered locations ASC locations non-compliant with one or more outcomes, by age On the table on the left, the number of locations non compliant for 2-3 quarters at the end of Q2 fell to 663 from 1,070 last quarter. There has been a small increase in the number of locations non-compliant overall, and those non-compliant for over a year. 1 The increase in ASC Q4 to Q1 is due to a small difference in the time range between the two sets of data used for the report. 13
CQC Performance – Q2, 2012– section 4, compliance outcomes Levels of compliance and non-compliance - registered locations IHC, Primary Dental Care and Independent Ambulance, locations non-compliant with one or more outcomes, by age The number of non-compliant locations overall has stayed static, in comparison with previous quarters, and those in groups of non-compliant for more than two quarters, 3 quarters and four quarters has increased. Again further analysis, including of the effectiveness of actions we take, is being taken forward. 14
CQC Performance - Q2, 2012,– section 5, equality outcomes All priorities – corporate equality objectives Commentary: This is the second update against the equality objectives. Notable progress compared to the objectives has been included below as well as risks and issues to delivery. Objective 3: A report on availability of equality intelligence and actions for the next stage of developing equality intelligence has been completed. Objective 4: The Regulatory Development directorate has been holding conversations with equality groups such as, Speak Out, Acting Together and eQuality Voices on our strategic review to ensure diverse groups contribute to the consultation as it develops. Planning is underway to carry out equality monitoring of experts by experience involved in the Acting Together programme. Work has also started on a project to support local CQC engagement with voluntary sector organisations which will build relationships with, for example, organisations for people with a learning disability. Objective 5 is measured by an increase in the number of downloads from the CQC website for accessible publications for example easy-to-read, large print or one of 6 languages. The website accessibility section has also been updated with a link on the home page to guide users with accessibility issues on how the site and contents can be made accessible. In addition to the downloads in accessible formats there has also been an increase in the number of hard copy requests from members of the public for publications or reports in easy-to-read, Braille, large print or one of 6 languages, there were 24 in Q1 compared with 212 in Q2. Objectives 7 to 9, overall these objectives are rated as amber following the results of the staff survey. Further analysis of the results are being carried out and a meeting led by HR in October will plan actions based on the analysis. 50% of staff said that they felt CQC is committed to an environment which is free from bullying and harassment. This result, and other survey results, will drive improvement action around bullying and harassment and staff experience of equal treatment at work. Work aimed at improving the diversity of the workforce included LGBT targeted advertising in London during recent compliance inspector recruitment. 15
CQC Performance – section 6, understanding the scorecard • Compliance • A key part of our regulatory work is carrying out inspections to determine whether services are meeting the government standards. Our inspections focus on the outcomes that we expect people to experience when they use a service and assess the care, treatment and support they receive. Inspections include information from a range of sources including service users, the public, commissioners and other regulators. The measures in this section monitor the commitments we made to inspect services this year. • Our inspections of NHS Trusts include inspecting acute hospitals. The term 'acute' is used when referring to active care or treatment (usually in secondary care) to adults, children, or both, that requires urgent or emergency care, usually within 48 hours of admission or referral from other specialties, and includes recovery time from surgery. • Our publication ‘How CQC regulates’ was published alongside our business plan and explains the types of inspection we undertake: • Scheduled inspections are planned by CQC in advance and can be carried out at any time. • Follow up inspections are made when we want to check whether the provider has made improvements we are requiring them to make • Responsive inspections are where inspectors inspect because of a specific and immediate concern. • Themed inspections are where we look at a particular type of care or issue across one or more care sectors, for example dignity and nutrition in NHS hospitals, or care for people with a learning disability in both care homes and hospitals. • Complaints • The CQC welcomes comments and suggestions about performance and the conduct of staff, including complaints about the CQC. Every complaint is investigated, and the feedback used to develop and improve the Commissions services. These measures demonstrate the volume, efficiency and overall effectiveness of how complaints are handled. Enforcement We have a variety of enforcement powers available to us where we find a service is not meeting one or more of the standards. When we exercise these powers we do so in a proportionate way, considering the effect on the public and those who use services. This suite of powers enables us to take swift, targeted action where services are failing the people who use them. We report in our scorecard on the enforcement actions we have taken. A detailed description of our enforcement actions is available on our website. One of the most often used of our enforcement powers is a Warning notice. A warning notice tells a 'registered person' that they are not complying with a condition of registration, requirement in the Act or a regulation or any other legal requirement we think is relevant. They can be published if the provider has been given the opportunity to make representations and where those representations if made are not upheld. Our enforcement powers also include suspending or cancelling the service’s registration, or prosecution. Equality Setting equality objectives is a requirement for public sector bodies under the Equality Act 2010 specific duties regulations. The objectives that we have set for the CQC are stretching and they focus on the biggest equality challenges that we face. The objectives are listed here and are reported quarterly, they will track delivery of supporting work against each objective. FinanceOur finance measures cover high level expenditure against budget and how effective the Commission is at collecting fees due. Human Resources The indicators in this area demonstrate the overall key human resources performance areas and cover, vacancy rate, staff turnover, the sickness rate and the Commission's establishment Publication The Commission publishes information about the services it regulates on the CQC website. It also produces a number of publications each year covering reports, surveys, themed inspections, reviews and studies. These measures indicates how well the Commission is in getting information to people in a timely way. Mental Health We protect the rights of people being treated under the Mental Health Act. Our aim is to improve the outcome for every person who uses care services commissioned under the Act. Indicators in this area cover, Commissioner visits, second opinion appointed doctor service and complaints from service users about providers. Commissioner's visit wards that detain people under the Mental Health Act. They meet patients and ensure staff use their powers appropriately. These measures track the Commission's performance against the number of visits planned. The SOAD service safeguards the rights of patients detained under the Mental Health Act who refuse the treatment prescribed to them or are deemed incapable of consenting. The role of the SOAD is to decide whether the treatment recommended is clinically defensible and if consideration has been given to the views and rights of the patient. National Customer Service Centre The National Customer Service Centre (NCSC) is the first point of contact for members of the public, service users and providers. These measures demonstrate the level of efficiency of the NCSC in terms of the speed at which we respond to the calls we receive and how they are prioritised, as well as the volume of calls we respond to. Other Inspections The Commission has the power to inspect a range of other specific areas, all of the measures in this area track our delivery of inspection activity against our plan. IR(ME)R - the Ionising Radiation (Medical Exposure) Regulations, our inspections monitor the use of ionising radiation for medical exposure. Controlled drugs covers a range of areas including assessing and overseeing how health and social care providers manage controlled drugs. The Pharmacy team supports Compliance function in specific activities relating to controlled drugs. There are also a number of joint inspections were the CQC work with other regulators, for example a 3 year programme of inspections covering all local authority areas in terms of their provisions for child safeguarding and looked after children with Ofsted, and joint inspections with HM Inspectorate of Prisons and HM Inspectorate of Probation. Registration To be registered with the CQC, providers must meet the essential standards of quality and safety for each regulated activity they provide at each location. Providers will not be registered if they cannot declare full compliance. These measures capture the efficiency of the Commission in processing these applications. 16