Download
1 / 1
10 likes | 185 Views
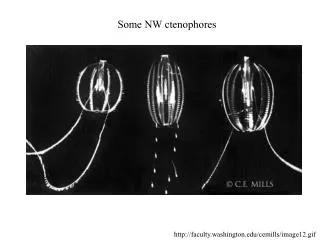
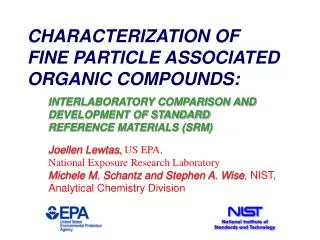
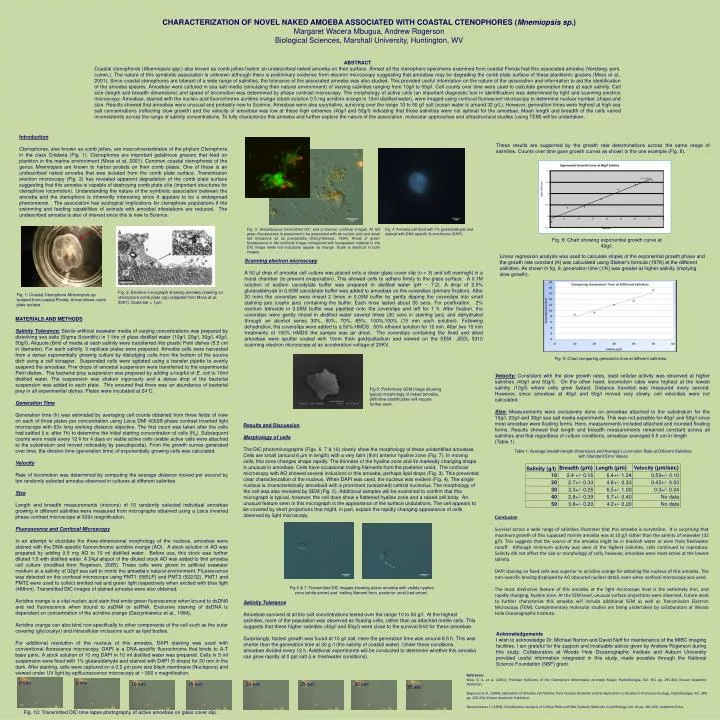
CHARACTERIZATION OF NOVEL NAKED AMOEBA ASSOCIATED WITH COASTAL CTENOPHORES ( Mnemiopsis sp. ) Margaret Wacera Mbugua, Andrew Rogerson Biological Sciences, Marshall University, Huntington, WV. ABSTRACT

E N D
CHARACTERIZATION OF NOVEL NAKED AMOEBA ASSOCIATED WITH COASTAL CTENOPHORES (Mnemiopsis sp.) Margaret Wacera Mbugua, Andrew Rogerson Biological Sciences, Marshall University, Huntington, WV ABSTRACT Coastal ctenophores (Mnemiopsis spp.) also known as comb jellies harbor an undescribed naked amoeba on their surface. Almost all the ctenophore specimens examined from coastal Florida had this associated amoeba (Versteeg, pers. comm.). The nature of this symbiotic association is unknown although there is preliminary evidence from electron microscopy suggesting that amoebae may be degrading the comb plate surface of these planktonic grazers (Moss et al., 2001). Since coastal ctenophores are tolerant of a wide range of salinities, the tolerance of the associated amoeba was also studied. This provided useful information on the nature of the association and information to aid the identification of the amoeba species. Amoebae were cultured in sea salt media (simulating their natural environment) of varying salinities ranging from 10g/l to 50g/l. Cell counts over time were used to calculate generation times at each salinity. Cell size (length and breadth dimensions) and speed of locomotion was determined by phase contrast microscopy. The morphology of active cells (an important diagnostic tool in identification) was determined by light and scanning electron microscopy. Amoebae, stained with the nucleic acid fluorochrome acridine orange (stock solution 0.5 mg acridine orange in 10ml distilled water), were imaged using confocal fluorescent microscopy to determine nuclear number, shape and size. Results showed that amoebae were unusual and probably new to Science. Amoebae were also euryhaline, surviving over the range 10 to 50 g/l salt (ocean water is around 32 g/L). However, generation times were highest at high sea salt concentrations (reflecting slow growth) and the velocity of amoebae was low at these high extremes (40g/l and 50g/l) indicating that these salinities were not optimal for the amoebae. Mean length and breadth of the cells varied inconsistently across the range of salinity concentrations. To fully characterize this amoeba and further explore the nature of the association, molecular approaches and ultrastructural studies (using TEM) will be undertaken. Introduction Ctenophores, also known as comb jellies, are macroinverterbrates of the phylum Ctenophora in the class Cnidaria (Fig. 1). Ctenophores are important gelatinous grazers that feed on plankton in the marine environment (Moss et at, 2001). Common coastal ctenophores of the genus Mnemiopsis are known to harbor protists on their comb plates. One of these is an undescribed naked amoeba that was isolated from the comb plate surface. Transmission electron microscopy (Fig. 2) has revealed apparent degradation of the comb plate surface suggesting that this amoeba is capable of destroying comb plate cilia (important structures for ctenophore locomotion). Understanding the nature of the symbiotic association between the amoeba and the ctenophore is inherently interesting since it appears to be a widespread phenomenon. The association has ecological implications for ctenophore populations if the swimming and feeding capabilities of animals with amoebal infestations are reduced. The undescribed amoeba is also of interest since this is new to Science. These results are supported by the growth rate determinations across the same range of salinities. Counts over time gave growth curves as shown in the one example (Fig. 8). Fig. 3: Simultaneous transmitted DIC and 2-channel confocal images. At left green fluorescence is presumed to be associated with ds nucleic acid and small red inclusions as ss precipitates (Darzynkiewicz, 1994). Areas of green fluorescence in the confocal image correspond with transparent material in the DIC image while red inclusions appear as orange. Scale is identical in both images. Fig. 4: Amoeba cell fixed with 1% gluteraldehyde and stained with DNA-specific fluorochrome (DAPI) . Fig. 8: Chart showing exponential growth curve at 40g/l. Linear regression analysis was used to calculate slopes of the exponential growth phase and the growth rate constant (K) was calculated using Stainer’s formula (1976) at the different salinities. As shown in fig. 9, generation time (1/K) was greater at higher salinity (implying slow growth). Scanning electron microscopy A 50 µl drop of amoeba cell culture was placed onto a clean glass cover slip (n = 3) and left overnight in a moist chamber (to prevent evaporation). This allowed cells to adhere firmly to the glass surface. A 0.1M solution of sodium cacodylate buffer was prepared in distilled water (pH ~ 7.2). A drop of 2.5% gluteraldehyde in 0.05M cacodylate buffer was added to amoebae on the coverslips (primary fixation). After 30 mins the coverslips were rinsed 2 times in 0.05M buffer by gently dipping the coverslips into small staining jars (coplin jars) containing the buffer. Each rinse lasted about 30 secs. For postfixation, 2% osmium tetroxide in 0.05M buffer was pipetted onto the coverslips and left for 1 h. After fixation, the coverslips were gently rinsed in distilled water several times (30 secs in staining jars) and dehydrated through an alcohol series 30%, 50%, 70%, 85%, 100%,100% (15 min each solution). Following dehydration, the coverslips were added to a 50% HMDS : 50% ethanol solution for 10 min. After two 10 min treatments of 100% HMDS the sample was air dried. The coverslips containing the fixed and dried amoebae were sputter coated with 10nm thick gold/palladium and viewed on the SEM JEOL 5310 scanning electron microscope at an acceleration voltage of 20KV. Fig. 2: Electron micrograph showing amoeba crawling on ctenophore comb plate (cp) (adapted from Moss et.al, 2001); Scale bar = 1µm. Fig. 1: Coastal Ctenophore Mnemiopsis sp. isolated from coastal Florida. Arrow shows comb plate surface. MATERIALS AND METHODS Salinity Tolerance:Sterile artificial seawater media of varying concentrations was prepared by dissolving sea salts (Sigma Scientific) in 1 litre of glass distilled water (10g/l, 20g/l, 30g/l, 40g/l, 50g/l). Aliquots (8ml) of media at each salinity were transferred into plastic Petri dishes (5.5 cm in diameter). For each salinity, 3 replicate plates were prepared. Amoeba cells were harvested from a dense exponentially growing culture by dislodging cells from the bottom of the source dish using a cell scrapper. Suspended cells were agitated using a transfer pipette to evenly suspend the amoebae. Five drops of amoebal suspension were transferred to the experimental Petri dishes. The bacterial prey suspension was prepared by adding a loopful of E. coli to 10ml distilled water. The suspension was shaken vigorously and a dense drop of the bacterial suspension was added to each plate. This ensured that there was an abundance of bacterial prey in all experimental dishes. Plates were incubated at 24˚C. Generation Time Generation time (h) was estimated by averaging cell counts obtained from three fields of view on each of three plates per concentration using Leica DMI 4000B phase contrast inverted light microscope with 63x long working distance objective. The first count was taken after the cells had settled (i.e. after 1h) to determine the initial starting concentration of cells (No). Subsequent counts were made every 12 h for 4 days on viable active cells (viable active cells were attached to the substratum and moved noticeably by pseudopodia). From the growth curves generated over time, the division time (generation time) of exponentially growing cells was calculated. Velocity Rate of locomotion was determined by computing the average distance moved per second by ten randomly selected amoeba observed in cultures at different salinities. Size Length and breadth measurements (microns) of 10 randomly selected individual amoebae growing in different salinities were measured from micrographs obtained using a Leica inverted phase contrast microscope at 630x magnification. Fluorescence and Confocal Microscopy In an attempt to elucidate the three-dimensional morphology of the nucleus, amoebae were stained with the DNA-specific fluororchrome acridine orange (AO). A stock solution of AO was prepared by adding 0.5 mg AO to 10 ml distilled water. Before use, this stock was further diluted 1:5 with distilled water. A 24μl aliquot of the diluted stock AO was added to 8ml amoeba cell culture (modified from Rogerson, 2005). These cells were grown in artificial seawater medium at a salinity of 32g/l sea salt to mimic the amoeba’s natural environment. Fluorescence was detected on the confocal microscope using PMT1 (585LP) and PMT2 (522/32). PMT1 and PMT2 were used to collect emitted red and green light respectively when excited with blue light (488nm). Transmitted DIC images of stained amoeba were also obtained. Acridine orange is a vital nucleic acid stain that emits green fluorescence when bound to dsDNA and red fluorescence when bound to ssDNA or ssRNA. Exclusive staining of dsDNA is dependant on concentration of the acridine orange (Darzynkiewicz et al., 1994). Acridine orange can also bind non-specifically to other components of the cell such as the outer covering (glycocalyx) and intracellular inclusions such as lipid bodies. For additional resolution of the nucleus of this amoeba, DAPI staining was used with conventional florescence microscopy. DAPI is a DNA-specific fluorochrome that binds to A-T base pairs. A stock solution of 10 mg DAPI in 10 ml distilled water was prepared. Cells in 5 ml suspension were fixed with 1% glutaraldehyde and stained with DAPI (5 drops) for 30 min in the dark. After staining, cells were captured on a 0.2 µm pore size black membrane (Nuclepore) and viewed under UV light by epifluorescence microscopy at ~ 900 x magnification. Fig. 9: Chart comparing generation time at different salinities. Velocity:Consistent with the slow growth rates, least cellular activity was observed at higher salinities (40g/l and 50g/l). On the other hand, locomotion rates were highest at the lowest salinity (10g/l) where cells grew fastest. Distance traveled was measured every second. However, since amoebae at 40g/l and 50g/l moved very slowly, cell velocities were not calculated. Size:Measurements were exclusively done on amoebae attached to the substratum for the 10g/l, 20g/l and 30g/l sea salt media experiments. This was not possible for 40g/l and 50g/l since most amoebae were floating forms. Here, measurements included attached and rounded floating forms. Results showed that length and breadth measurements remained constant across all salinities and that regardless of culture conditions, amoebae averaged 5.5 um in length (Table 1). Fig 5: Preliminary SEM image showing typical morphology of naked amoeba, definitive identification will require further work . Results and Discussion Morphology of cells The DIC photomicrographs (Figs. 6, 7 & 10) clearly show the morphology of these unidentified amoebae. Cells are small (around 6 µm in length) with a very faint (thin) anterior hyaline zone (Fig. 7). In moving cells, this zone changes shape rapidly. The thinness of the hyaline zone and its markedly changing shape is unusual in amoebae. Cells have occasional trailing filaments from the posterior uroid. The confocal microscopy with AO showed several inclusions in this amoeba, perhaps lipid drops (Fig. 3). This prevented clear characterization of the nucleus. When DAPI was used, the nucleus was evident (Fig. 4). The single nucleus is characteristically amoeboid with a prominent (unstained) central nucleolus. The morphology of the cell was also revealed by SEM (Fig. 5). Additional samples will be examined to confirm that this micrograph is typical, however, the cell does show a flattened hyaline zone and a raised cell body. An unusual feature seen in this micrograph is the appearance of the surface undulations. The cell appears to be covered by short projections that might, in part, explain the rapidly changing appearance of cells observed by light microscopy. Table 1: Average breadth/length dimensions and Average Locomotion Rate at Different Salinities with Standard Error Values Salinity (g/l) Breadth (μm) Length (μm) Velocity (μm/sec) 10 2.4 +/- 0.16 6.4+/- 1.24 0.59+/- 0.10 20 2.7+/- 0.33 4.8+/- 0.33 0.43+/- 0.03 30 3.3+/- 0.26 6.5+/- 1.00 0.3+/- 0.04 40 2.8+/- 0.39 5.7+/- 0.40 No data 50 3.8+/- 0.20 4.2+/- 0.20 No data Conclusion Survival across a wide range of salinities illustrates that this amoeba is euryhaline. It is surprising that maximum growth of this supposed marine amoeba was at 10 g/l rather than the salinity of seawater (32 g/l). This suggests that the source of the amoeba might be in brackish water or even from freshwater runoff. Although minimum activity was seen at the highest salinities, cells continued to reproduce. Salinity did not affect the size or morphology of cells, however, amoebae were most active at the lowest salinity. DAPI staining on fixed cells was superior to acridine orange for detailing the nucleus of this amoeba. The non–specific binding displayed by AO obscured nuclear detail, even when confocal microscopy was used. The most distinctive feature of this amoeba at the light microscope level is the extremely thin, and rapidly changing, hyaline zone. At the SEM level, unusual surface projections were observed. Future work to further characterize this amoeba will include additional SEM as well as Transmission Electron Microscopy (TEM). Complementary molecular studies are being undertaken by collaborators at Woods Hole Oceanographic Institute. Fig 6 & 7: Transmitted DIC images showing active amoeba with visible hyaline zone (white arrow) and trailing filament from posterior uroid (red arrow). Salinity Tolerance Amoebae survived at all the salt concentrations tested over the range 10 to 50 g/l. At the highest salinities, more of the population was observed as floating cells, rather than as attached motile cells. This suggests that these higher salinities (40g/l and 50g/l) were close to the survival limit for these amoebae. Surprisingly, fastest growth was found at 10 g/l salt. Here the generation time was around 8.5 h. This was shorter than the generation time at 30 g /l (the salinity of coastal water). Under these conditions, amoebae divided every 12 h. Additional experiments will be conducted to determine whether this amoeba can grow rapidly at 0 ppt salt (i.e. freshwater conditions). Acknowledgements I wish to acknowledge Dr. Michael Norton and David Neff for maintenance of the MIBC imaging facilities. I am grateful for the support and invaluable advice given by Andrew Rogerson during this study. Collaborators at Woods Hole Oceanographic Institute and Auburn University provided useful information integrated in this study, made possible through the National Science Foundation (NSF) grant. References Moss G. A. et al. (2001); Protistan Epibionts of the Ctenophore Mnemiopsis mccradyi Mayer; Hydrobiologia, Vol. 451 pp. 295-304, Kluwer Academic Publishers Rogerson et al. (1994); Estimation of Amoeba Cell Volume from Nuclear Diameter and its Application to Studies in Protozoan Ecology; Hydrobiologia, Vol. 284 pp. 229-234; Kluwer Academic Publishers Darzynkiewicz Z. (1994); Simultaneous Analysis of Cellular RNA and DNA Content; Methods in cell Biology, Vol. 41 pp. 401-420, Academic Press 0 sec 5 sec 10 sec 15 sec 20 sec 25 sec 30 sec 35 sec Fig. 10: Transmitted DIC time lapse photography of active amoebae on glass cover slip.