Download
1 / 18
180 likes | 305 Views
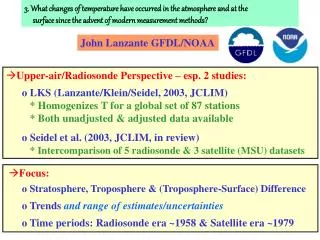
3. What changes of temperature have occurred in the atmosphere and at the surface since the advent of modern measurement methods?. John Lanzante GFDL/NOAA. Upper-air/Radiosonde Perspective – esp. 2 studies: o LKS (Lanzante/Klein/Seidel, 2003, JCLIM)

E N D
3. What changes of temperature have occurred in the atmosphere and at the surface since the advent of modern measurement methods? John Lanzante GFDL/NOAA • Upper-air/Radiosonde Perspective – esp. 2 studies: • o LKS (Lanzante/Klein/Seidel, 2003, JCLIM) • * Homogenizes T for a global set of 87 stations • * Both unadjusted & adjusted data available • o Seidel et al. (2003, JCLIM, in review) • * Intercomparison of 5 radiosonde & 3 satellite (MSU) datasets Focus: o Stratosphere, Troposphere & (Troposphere-Surface) Difference o Trends andrange of estimates/uncertainties o Time periods: Radiosonde era ~1958 & Satellite era ~1979
1958-1997 – Global Trends(Seidel et al; in review, JCLIM) 5 Radiosonde Datasets(Angell-63 & 54, HadRT, LKS_adj, [RIHMI[) Stratosphere (100-50 hPa) ~ -.45 (~ -.55 to -.37 [-.22]) K/decade Troposphere (850-300 hPa) ~ +.10 (~ +.08 to +.12 [+.04]) K/decade 1979-1997 – Global Trends(Seidel et al; in review, JCLIM) Radiosonde Satellite HadRTLKS_adjUAH RSS Stratosphere (MSU4) -.93 -.76 -.53 -.45 Troposphere (MSU2) -.15 -.05 -.05 +.04 =>Limitation: Apples vs. Oranges Comparisons Inconsistent spatial & temporal sampling, data handling, etc. _________________________________________________________ Radiosonde: Angell-63= 63 Stations (Angell)Angell-54=54 Stations (Angell) HadRT=Gridded (Parker et al.)LKS=87 Stations (Lanzante et al.) RIHMI=Gridded (Sterin) Satellite-Microwave Sounding Unit (MSU): UAH=Gridded (Christy & Spencer)RSS=Gridded (Wentz et al.)
1979-1997 – Global Trends(LKS = Lanzante/Klein/Seidel) Identical sampling Radiosonde Satellite [spatial/temporal] LKS_unLKS_adjUAH Stratosphere (MSU4) -.86 -.65 -.57 Troposphere (MSU2) -.11 -.06 -.03 =>Homogeneity adjustment reduces disparity considerably =>But (from previous slide) RSS still warmer than UAH: Colder LKS_un < LKS_adj < UAH < RSS Warmer => More radiosonde adjustment needed ? ________________________________________________________ Radiosonde: LKS_un =87 Stations (Lanzante et al.) – No homogeneity adjustments LKS_adj=87 Stations (Lanzante et al.) – Homogeneity adjusted Satellite-Microwave Sounding Unit (MSU): UAH=87 Stations (Christy & Spencer)
Tropical Lower-Tropospheric Lapse (surface-700 hPa) Source: LKS Zone: 30N-30S Stations: 20 & 16 Lapse: Smooth monthly Trends: 1979-1997 Levels: Surface-700 => 1976/77 Jump down => ENSO (reduced amplitude after 1976/77) =>Satellite-era trends: Sensitive to radiosonde data homogenization
1979-97 Trend of Tropical Lapse (surface-700 hPa) [K/decade] (1) (2) (3) (Source: LKS) LKS Unadjusted .17 .17 .10 LKS Adjusted .10 .00 .00 Brown et al. (2000) ~.20 Gaffen et al. (2000) ~.08 (1) = Difference in separate trends surface & 700 (2) =Trend of monthly (surface-700) time series at each station (3) =Same as (2) except reduced network (1959-1997) => Caution in interpreting lapse trends: complexities & sensitivities
Challenges – Issues Which Need To Be Resolved Reconcile trend differences between datasets: o Sonde vs. sonde, satellite vs. satellite, sonde vs. satellite o Sampling: spatial & temporal differences? o Better understanding of inhomogeneities & adjustment methods o Other data handling issues? {quality control, etc.} • Lapse rate variations: o Tropics: * How much of trend since 1979 is real? * What’s going on with 1976/77? o What about extratropics?
Source: LKS= Lanzante/Klein/Seidel Region: Global= (87 Stations) Temperature: Smooth monthly Arrows: Major volcanoes Levels: 400 hPa & 70 hPa Stratosphere: Cooling trend ~1980, Volcanoes, QBO Troposphere: Quasi-linear warming trend ~ 1960s, ENSO & other
Source: LKS= Lanzante/Klein/Seidel Zones/Stations: NH= 30-90N / 37 TP= 30N-30S / 24 SH= 30-90S / 8 Temperature: Smooth monthly Vertical Bar: 1976/77 Level: 400 hPa NH: Warming since ~1980 SH: Warming ~1960s to ~1980 [very few stations] Tropics: Jump up ~1976/77
1958-1997 – Global Trends(Seidel et al; in review, JCLIM) [K/decade] 5 Radiosonde DatasetsAng63 Ang54 HadRT LKS_adj RIHMI Stratosphere (100-50 hPa) -.55 -.48 -.44 -.37 -.22 Troposphere (850-300 hPa) +.08 +.11 +.09 +.12 +.04 1979-2001 – Global Trends(Seidel et al; in review, JCLIM) Radiosonde Satellite HadRTLKS_adjUAH RSS Stratosphere (MSU4) -.88 -- -.52 -.43 Troposphere (MSU2) -.08 -- +.01 +.10 Supplementary material: Seidel et al. 2003 Radiosonde: Angell-63= 63 Stations (Angell)Angell-54=54 Stations (Angell) HadRT=Gridded (Parker et al.)LKS=87 Stations (Lanzante et al.) RIHMI=Gridded (Sterin) Satellite-Microwave Sounding Unit (MSU): UAH=Gridded (Christy & Spencer)RSS=Gridded (Wentz et al.)
Lapse (surface-700 hPa) Trends 1979-1997 * Unadjusted= red*Adjusted= blue *Arrow up/down= 0.2 K/decade *Blue only: no adjustment *Red only: delete (too little data for trend)
Surface Temperature Trends 1979-1997 * Unadjusted= red*Adjusted= blue *Arrow up/down= 0.2 K/decade *Blue only: no adjustment *Red only: delete (too little data for trend)
Lower Tropospheric Lapse Rate 1979-97 Controversy (Debate & NRC Committee) o +CO2 GCMs more warming aloft than surface (tropics) o Satellite era more warming at surface Q: Are lapse rate trends sensitive to adjustment & other details? Trend of Surface-700 hPa T (1979-97) [K/decade] (1) (2) (3) NH Un .25 .17 .15Low sensitivity NH Adj .18 .16 .16 SH Un -.11 -.04 -.23Small number of stations SH Adj .15 .14 .05Surface T sensitive to adjustment Tropics Un .17 .17 .10 Surface T sensitive to adjustment Tropics Adj .10 .00 .00 Brown et al. ~.20; Gaffen et al. ~.08 Globe Un .13 .16 .11 Some sensitivity Globe Adj .10 .14 .07 * Caution in interpreting lapse trends[spatial & temporal complexities] (1) = Difference in separate trends surface & 700 (2) = Trend of monthly time series: surface-700 (3) = Same as (2) except reduced network (1959-97)
Lower Tropospheric Lapse Rate 1959-97 Trend of Surface-700 hPa T (1979-97) [K/decade] (1) (2) (3) NH Un .06 .06 .06 NH Adj .03 .00 .00 SH Un -.41 .01 -.02 SH Adj -.23 .04 .-06 Tropics Un .00 -.06 -.08 Tropics Adj -.08 -.05 -.07 Globe Un .01 .02 .00Globe Adj -.05 .00 -.04 • = Difference in separate trends surface & 700 • (2) = Trend of monthly time series: surface-700 • (3) = Same as (2) except reduced network (1959-97)
Lower Tropospheric Lapse Rate Time Series Ticks: 0.2 K o Median sfc-700 over all stations in a zone (smoothed) [1959-97 stations] o Red = Unadjusted o Colored= Adjusted o SH: Very sensitive to adjustment; limited spatial sampling o NH: 1979-97 trend is fortuitous; multi-year time scales dominate o Tropics:Lags SOI ~ 6 mon. (weaker after ‘76); 1976-77 dominates 1979-97 trend is a subtle feature!
87 Station Network Latitude Zones (for analyses): NH(30-90N) ~ 35 stations Tropics(30N-30S)~ 25-30 stations SH(30-90S)~ 8-15 stations