Download
1 / 20
200 likes | 309 Views
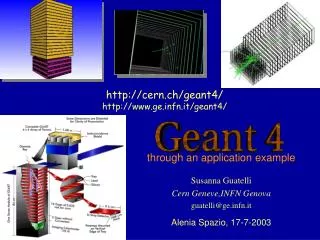
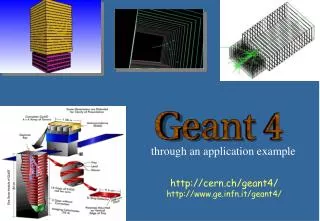
CHEP06, T.I.F.R. Mumbai, 13-17 February 2006. Geant4 Acceptance Suite for Key Observables. J. Apostolakis, I. MacLaren, P. Mendez Lorenzo, A. Ribon, J.P. Wellisch CERN PH/SFT. Outline. Motivation and strategy Description of the suite

E N D
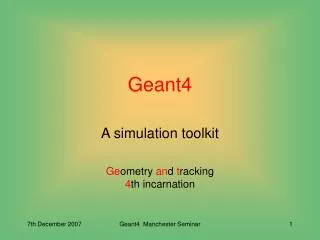
CHEP06, T.I.F.R. Mumbai, 13-17 February 2006 Geant4 Acceptance Suitefor Key Observables J. Apostolakis, I. MacLaren, P. Mendez Lorenzo, A. Ribon, J.P. Wellisch CERN PH/SFT
Outline • Motivation and strategy • Description of the suite • Some results for the December 2005 Geant4 release (G4 8.0) • Another application • Summary and outlook
Motivation and strategy Our goal is to detect any difference between twoGeant4 versions, by comparing a large number of physics observables. Only those distributions which are statistically different (i.e. unlikely to be originated from the same parent distribution, whatever it is) should be visually examined by someone, to understand the origin of such difference, either a bug or an improvement. As a start, we consider only calorimeter observables sensitive to hadronic physics.
Some remarks • It is very important that the regression testing is automatic , because only in this way it is possible, in practice, to consider a very large number of distributions, and use it regularly, at least before each new release. • To do that we need a statistical package that offers several statistical tests (not only Chi2 and Kolmogorov-Smirnov!), to increase the chances to spot any kind of discrepancy between two distributions.
Simplified Calorimeter setup • It reproduces, in a simplified way, all the LHC calorimeters: Fe-Sci , Cu-Sci , Cu-LAr , W-LAr • Pb-Sci ,Pb-LAr , PbWO4 . • Beam particle type: ± , K± , KL0 , p , n , e- . • Beam energy: 1, 2, 3, …, 10, 20, 30, 40, 50, 60, 80, 100, 120, 150, 180, 200, 250, 300(1000)GeV. • The calorimeter is a box. The user can choose: • - the total thickness of the absorber (in [mm] or ) • - the thickness of the active layer • - the number of layers • - the number and the size (in [mm] or ) of the rings for the • lateral shower profile.
Observables: • - total energy deposit in all active layers • - total energy deposit in the whole calorimeter • - energy deposit in each active layer • (longitudinal shower profile) • - energy deposit in each ring (i.e. radial bin) • (lateral shower profile). • The program produces in output a HBOOK n-tuple, which stores all the above distributions. • Then another program reads two of these n-tuples, makes the statistical tests of the distributions, and produces a .PS file whenever the p-value of a test is below a certain threshold (currently 1%).
CPU issue • 7 calorimeters x 8 particles x 24 beam energies x 5000 events x 5 Geant4 physics configurations. • About ≥0.07 sec/GeV ( @1 GHz CPU) to simulate a hadronic shower. • Use some biasing techniques (keep 1 e-/e+//n every 2 or 4 with weight 2 or 4), and kill neutrons below 1 MeV, to speed up the execution. • Overall, it takes few years of CPU time, but concentratedin 1-2 weeks: need of theGRID !
Geant4 release 8.0 (December 2005) • G4 8.0 candidate versus G4 7.1.p01 . • 10 lambdas, 20 layers, 4 mm active layers, 10 rings of increasing size, starting from 0.1 lambdas; biasing for beam energies 10 GeV . • SLC 3.0.x g++ 3.2.3 . Run on the GRID as Geant4 Virtual Organization. ≈ 120 CPUs in 7 sites in 6 countries. • ≈1300 jobs per each Geant4 physics configuration. Each job that ends normally produced a tar-ball of about 3 MB size containing the results.
Results • 5 GRID installations; ≈ 12,000 jobs submitted to the GRID; ≈ 50,000 PostScript files produced (about 10% of observables that have been checked) • ≈99% GRID success rate (this is a significant improvements w.r.t. previous GRID deployments, thanks to a careful selections of the sites where to run). • 5 Geant4 physics configurations; 3 bugs found; 1 critical issue identified (elastic scattering).
G4 7.1.p01 G4 8.0 cand P-value = 0.9% Visible energy in the first ring Log scale Visible energy in the first ring
G4 7.1.p01 G4 8.0 cand P-value = 10-18 Total visible energy Log scale Total visible energy
Summary plots • As post-processing, using only the log files produced during the simulation, some summary .PS plots can be produced: - longitudinal shower profiles - transverse shower profiles - sampling fractions vs. beam energy - energy resolutions vs. beam energy - e/ ratios vs. beam energy • Some unphysical “jumps” are observed at 10 GeV, because biasing is not applied below such a value.
QGSC Fe-Sci π+ G4 8.0 cand G4 7.1.p01 (GeV)
G4 7.1.p01 QGSC Fe-Sci π+ G4 8.0 cand (GeV)
Another use of this tool It is interesting and useful to study the effects of physics changes (e.g. in multiple scattering, hadronic elastic scattering, total cross-sections, and in any other physics model), with a simplified calorimeter setup, with pure MC information, without real life complications (e.g. beam composition/profile, noise, cross-talk, clustering, reconstruction).
Studies in simplified calorimeter setups (I) “CMS HCAL” - 150 GeV Cu-Sci 10 25 layers (6 cm Cu) 4 mm Sci 5000 events G4 7.1p01 QGSP LHEP Log scale
Studies in simplified calorimeter setups (II) “CMS HCAL” - 150 GeV Cu-Sci 10 25 layers (6 cm Cu) 4 mm Sci 5000 events G4 7.1p01 QGSP LHEP Log scale
Summary We have a tool which is useful for three purposes: • robustness testing; • regression testing; • detection of physics effects on calorimeter observables. We are using it since one year, and we are planning to deploy it even more extensively in the future.
Outlook We aim to improve and extend this tool in the following directions: • Include more statistical tests , and study theirstatisticalpower. • Find complementary (in particular, more global and faster) ways to spot differences. • Monitor CPU time, number of steps and tracks,andother observables. • Extend to electromagnetic shower shapes,andintegrate all the efforts for testing Geant4.