Download
1 / 24
240 likes | 357 Views
Spatial Patterns for Alternative Vehicle Fuel Station Locations in Maryland. A. Bartholomew GEOG 651 Final Project November 2013. Study Area. The Study area is the state of Maryland. Research Background and Motivation.

E N D
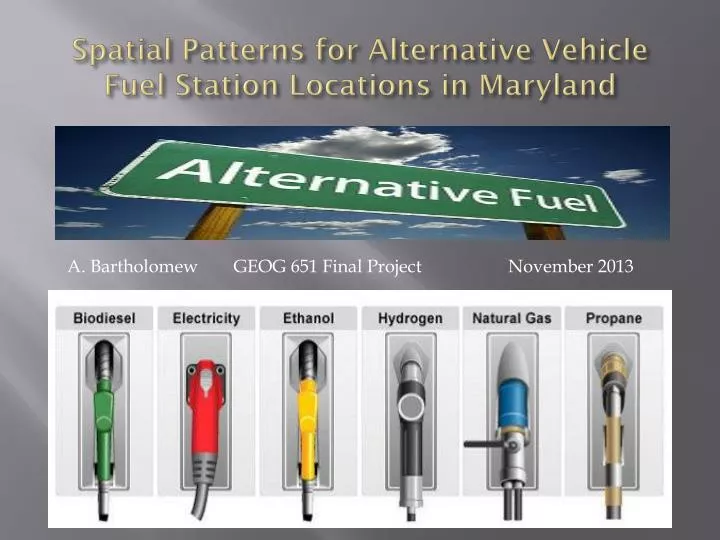
Spatial Patterns for Alternative Vehicle Fuel Station Locations in Maryland A. Bartholomew GEOG 651 Final Project November 2013
Study Area The Study area is the state of Maryland
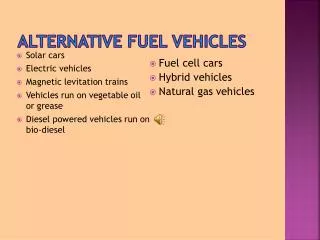
Research Background and Motivation I will illustrate the level of Alternative Vehicle Fuel Station infrastructure investment within the State of Maryland, this study will examine Public Accessible Electric Vehicle Charging Stations. E-85 fueling stations; E-85 is an important alternative fuel source that has been widely available to consumers for several years. Compressed natural gas fueling stations are important because there has been a significant increase for public transportation buses that operate on compressed natural gas. The motivation behind my research topic relates to what our political leaders are doing to minimize the effects of Green House Gasses in our environment through AFVs infrastructure investments. I will investigate where are the closest AFVs. People living in apartments cannot utilize at home plug-in electrical vehicles, but if they were able to recharge/refuel a AFV at work or close by their place of residence, that consumer might consider purchasing a AFV; thus, reducing carbon emissions and slowing the process of global warming in the process.
Research Problem and Objectives This final project will attempt to answer these two questions: Examine the null hypothesis that the spatial distribution of Alternative Vehicle Fuel Stations (AVFs) locations in the State of Maryland are clustered. Identify the AFV station hot spots and see if any of the variable income per city can highlight trends within the data.
Data Sources Alternative Vehicle Fuel Station Location Data Source http://www.afdc.energy.gov/data_download/ http://www.mdot.maryland.gov/Office_of_Planning_and_Capital_Programming/Electric_Vehicle/Documents/Update_Presentation_051812.PDF Boundary Shapefiles http://www.census.gov/cgi-bin/geo/shapefiles2013/main Block group and other Tigerfiles http://www.census.gov/geo/maps-data/data/tiger-data.html MetaData http://www.census.gov/geo/mapsdata/data/docs/tiger/prejoined/ACSMetadata2011.txt
Methodology How To Create Alternative Fuel Station Data from CSV file into a Shapefile for ArcGIS Step 1 - Get AFVs data from Department of Energy web page Step 2 - Data comes in the form of a CSV or excel data. Open the CSV file in Excel Step 3 – Use a data filter to filter for specific data by State MD or Fuel station type; planed, existing, under construction, public or private stations. Step 4 – Copy the data you want based on filter settings into another Excel tab, then save the file as an excel document. Doc.xls Step 5 - Open Arc Catalog and find the folder containing the newly created Excel file for AFVs data for the state of MD.
Methodology How To Create Alternative Fuel Station Data from CSV Cont. Step 6 - Right click the excel data tab of interest, in this case the tab sheet is named MD Data Step 7 – Select create feature class from X,Y table, this creates the point data within Arc Map from the latitude and longitude data coordinates within the excel data. Step 8 - Also be sure to give this data a projection before saving the data back into the appropriate Geodatabase. This creates a shapefile from the X,Y coordinates for the AFVs. Step 9 - Save this file, then right click this file and export the newly created file into a Geodatabase. Step 10 - Open ArcGIS and use the add data button to add in the newly created shapefile layer.
Discussion Point Pattern Analysis Mean Center: In this study, it is important to show the mean center. The mean center identifies the geographic center for the AFVs in Maryland. The mean center is captured by finding the average X-coordinate and average Y-coordinate for all points. Directional Ellipse 1 Standard Deviation & 2 Standard Deviation: This measurement tells us whether the AFVs point distribution exhibits a directional trend. In this case, we can see both a 1 SD and 2 SD distance. The results of both these directional ellipses show there is an elongated horizontal direction for the ellipses. This shows that the spatial patterns of AFVs in Maryland, takes a more east to west orientation compared to a north-south orientation. This is interesting because the majority of the AFVs in Maryland are found in the Baltimore City and Baltimore County areas, which have a north – south orientation. The results of the directional ellipse investigation show there is a greater affect on the spatial direction based upon the shape of the study region, compared to the actual location of the AFVs locations.
Results of AFVs by County and Income by County Slides These two slides show the total number of AFVs in each county and also the median household income in the past 12 months for each county in Maryland. It is important to examine how income effects the demand for AFV stations in the county. For these two slides we see a relationship between higher income areas possessing a greater level of alternative fueling station infrastructure. The ownership demographic of alternative fuel vehicle owners is an income over 100k, college educated with an advanced degree, and residing in single family homes. http://www.mdot.maryland.gov/Office_of_Planning_and_Capital_Programming/Electric_Vehicle/Documents/Update_Presentation_051812.PDF
Discussion General G - Statistic Global The General G Statistic (G Stat) is a global measure used to detect the presence of hot and cold spots within an area. A large G Stat value indicates a presence of hot spots while low G Stat values indicates cold spots. The resulting index of the observed General G statistic is 0.992379, with a Z-Score of 2.279664. The interpretation of the G Statrelies on its standardized Z-score. The G Statvalue of 0.992379 implies the presence of more areas with cold spots, or areas where there are clusters of areas with low population levels, opposed to there being greater amount of areas with clusters of high population areas. In this case the G Statobserved is larger than the expected G Stat , thus there is a greater potential for hot spots. The Z-Score of 2.279664, says there is less than a 5% chance that the data clustering is random. The General G statistic considers the proportion of the spatial association accounted for within a specified measure of distance units of each observation. In general, as distances increase, the G Stat also increases. In the first case the preset distance was 10 miles and with a preset distance of 20 miles we can expect the G Statto become larger. The G stat becomes larger because distance increases, the G Statalso increases because as global measures, G Statis designed to assess localized spatial autocorrelation surrounding individualized locations or areal units.
Results General G - Statistic Local Hot Spot Analysis (zoom)
Discussion General G - Statistic Local Hot Spot Analysis Global statistics identifies and measures patterns for the entire study area. The global, Getis-Ord G, is based on the clusters present in the data; this data analysis method provides information about the clusters present in the data set. Getis-Ord G also examines if the AFVs are evenly distributed, or if the AFVs display an unusual spike in clustered values. Local Getis-Ord G stat provides analysis regarding hot spots and cold spots based on the Z-scores. Cold spots have negative Standard Deviation values; the hot spots have positive standard deviations. Local statistics identify variation across the study area, focusing on individual features and their relationships to nearby features (i.e. specific areas of clustering). G statistics are useful when negative spatial autocorrelation (outliers) are negligible within the data set. Getis-Ord G map exhibits hot spots in central region of the state; with a focal of the hotspots in Baltimore City and County areas.
Discussion Moran’s I Local Results Anselin’s local Moran’s ‘I’ provides analysis of present clusters within the data, and if the clusters are of hot spots or cold spots based on positive or negative Z-score values. This is a local measure of the strength of patterns for each specific feature. This measure compares the value of each feature in a pair to the mean value for all features in the study area. Positive I’’ values are derived from features that are surrounded by features with similar values, either high or low. Also, statistically significant clusters can consist of high values or low values. A negative ‘I’ value is derived from features that are surrounded by features with dissimilar values. Statistically significant outliers can be a feature with a high value surrounded by features with low values or a feature with a low value surrounded by features with high values. In this case local hotspots for the AFVs are in Baltimore City and Baltimore County, and cold spots are seen in the areas where the Z-score is negative; three cities in Montgomery County, seen in red have negative Z-scores.
Discussion Global Moran’s I Results Interpretation: since the Moran’s ‘I’ index is less than one (-0.00431), based on the Global Moran’s ‘I’ statistical test; the data shows there is a negative spatial autocorrelation related to the location of AFVs in Maryland. The Moran’s ‘I’ value is negative, but still a fairly low positive value, which indicates clustering of similar values, and these values still indicate a random location for AFVs. With a Z-Score of 1.252293 , there is less than 1% chance that the data clustering is not random. The randomness of AFVs could be an effect of station point location within the state, IE, there are not enough AFVs in the state of Maryland to study the stations on a global level. The local statistical test provides better analysis; because the AFVs possess a very centralized spatial pattern. This is a global analysis of the AFVs and based on this statistical test we can say the location of the AFVs in Maryland are randomly dispersed within the state. This is not exactly true, we know that AFVs are currently located in areas that have wealth and areas that have high populations, thus this this may not be the best statistical test for the data analysis.
Conclusion When testing the null hypothesis: the General G Statistical test, Moran’s I local and global test, and variable median household income earned in 2011. Based upon the statistical analysis of these tests, I can safely fail to reject the null hypothesis that the spatial distributions of Alternative Vehicle Fuel Stations (AVFs) in the State of Maryland are clustered. The AFVs in Maryland are clustered; the main cluster area is Baltimore City and Baltimore County. Identify the hot spots where the AFV station locations are and see if any of the variable income can highlight trends within the data. We see a correlation between higher income areas possessing a greater level of alternative vehicle fueling station infrastructure. The ownership demographic of alternative fuel vehicle owners is an income over 100,000 per year. The only counties that have more than five AFVs are in Montgomery County, Prince George County, Anne Arundel County, Baltimore City and Baltimore County. All of these areas have a large number of people who reside in the county and earn more 100,000 dollars annually. Thus , I can conclude that AFVs infrastructure will continue to grow in wealthy areas only, because these are the only areas that can afford the initial cost of vehicle purchases.
Further Work, Extended Study Here are several ideas on how to continue working on this project: Analyze data for planned stations; this national data is available from the Department of Energy. Also, the data can be analyzed on a regional scale or a more localized city level scale . In addition, the data can be analyzed to identify national hotspots, i.e. Western states push for increase AFVs and infrastructure. Analyze the rate of new AFVs infrastructure projects, in other states and compare both the current level of alternative fuel station infrastructure and the planed new construction project do developer new AFVs. I can examine the AFV market. Specifically, what are the obstacles & deterrents from purchasing an alternative fuel vehicle. I can investigate which states provide incentives for purchase alternative fuel vehicles, and the effectiveness of their incentives.
References Academic Journal Article Review Spatial Statistics GEOG 651 1. Romm, J., (2006 November) The Car and Fuel of the Future, Energy Policy, Volume 34, Issue 17, Pages 2609–2614 2. Shinnar, R., (2003) The hydrogen economy, fuel cells, and electric cars, Technology in Society 25, Pages 455–476 3. Shukla, A., (2011 August) An optimization framework for cost effective design of refueling station infrastructure for alternative fuel vehicles, Computers & Chemical Engineering, Volume 35, Issue 8, Pages 1431–1438 4. Struben, J., (2008 May) Transition challenges for alternative fuel vehicle and transportation systems, Environment and Planning B: Planning and Design 2008, volume 35, pages 1070 -1097 5. Achtnicht, Martin; Bühler, Georg; Hermeling, Claudia (2008) : Impact of Service Station Networks on Purchase Decisions of Alternative-fuel Vehicles, ZEW Discussion, Papers, No. 08-08