Download
1 / 12
120 likes | 293 Views
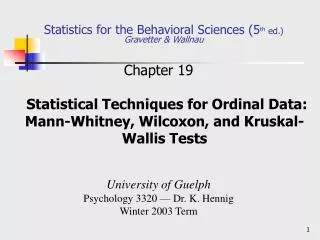
Statistics for the Behavioral Sciences (5 th ed.) Gravetter & Wallnau. Chapter 19 Statistical Techniques for Ordinal Data: Mann-Whitney, Wilcoxon, and Kruskal-Wallis Tests. University of Guelph Psychology 3320 — Dr. K. Hennig Winter 2003 Term. Introduction. Widespread use of ranking:

E N D
Statistics for the Behavioral Sciences (5th ed.)Gravetter & Wallnau Chapter 19Statistical Techniques for Ordinal Data: Mann-Whitney, Wilcoxon, and Kruskal-Wallis Tests University of GuelphPsychology 3320 — Dr. K. HennigWinter 2003 Term
Introduction • Widespread use of ranking: • longest river in the world = Nile • most popular magazine = Reader’s Digest • your favourite ice-cream? • Such data are easy to obtain; no need to rate 31 flavours on a 100-point scale • easy but less sophisticated than interval or ratio scales
Table 19-1 (p. 634) The best cities for singles as ranked by Forbes.com (2002). • no distance datare. closeness of ranking - whatmeans and SDsprovide • Reasons for using: • simplicity (who’s taller?) • where basic assumptions areviolate(Normal distribution, homog’-of-var, infinite score)
Hypotheses tests with ordinal data • Mann-Whitney test for independent samples (alternative to a independent-measures t-test) • Wilcox test - alternative to repeated-measures t • Kruskall-Wallis test - alternative to sg-factor, independent measures ANOVA
In part (a), the scores from the two samples are clustered at opposite ends of the rank ordering. In this case, the data suggest a systematic difference between the two treatments. Part (b) shows the two samples intermixed evenly along the scale, indicating no consistent difference between treatments. I. Mann-Whitney U-test
Compare two distributions (vs. Ms) • Ho: there is no difference between the two treatments; no tendency for the ranks in one treatment condition to be systematically higher (or lower) than the ranks in the other condition • H1: There is a difference, ranks in one condition are systematically higher (or lower) than the ranks in the other condition
Example 19.1 • Sample A: 27, 2, 9, 48, 6, 15 • Sample B: 71, 63, 18, 68, 94, 8 Calculate U-value for Sample A & B, UA = 6+6+5+4+4+4 = 30
Formula • ∑RA = 1+2+4+5+7+8=27,nA = n of sample A • UA = 33, UB = 7; final U is the smaller of the two • Reported as U = 7, p > .05
Assumptions • not require normal distributions or homogenity-of-variances, • but does require independent observations and assumes dependent variable is continuous • Note. if you find many ties (unlikely by chance) than question whether Mann-Whitney U is correct test.
II. Wilcox Signed-Rank test • ∑R+ = 6+2+5+3 = 16 • ∑R- = 1+4 = 5; select the smaller, so T = 5, p>.05with ranks for increases totaling … decreases… Two companies with no change were discarded prior to analysis
Original data consisting of numerical scores are shown. The original scores are listed in order and assigned ranks using the standard procedure for ranking tied scores. The ranks are then substituted for the original scores to create the set of ordinal data shown in table (b). III. Kruskal-Wallis test compute mean of the tied scores (8+9+10)/3
An example of ordinal data including the notation used for a Kruskal-Wallis test - they include some tied measurements that appear as tied ranks.Evaluate with χ2 table. H =3.79 (2, N = 15), p > .05 df = #groups-1