System Control Center
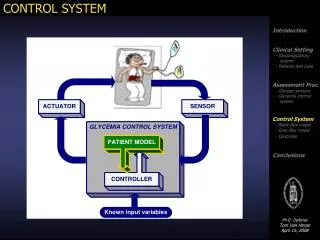
Fig. 1 Automated chambers deployed in continuous corn treatment. Chambers are removed only during necessary farm operations. Fig. 2 Comparison of the automated system (dark boxes) and static chambers (white cylinders). The automated system control is in the trailer. Single flux event.

System Control Center
E N D
Presentation Transcript
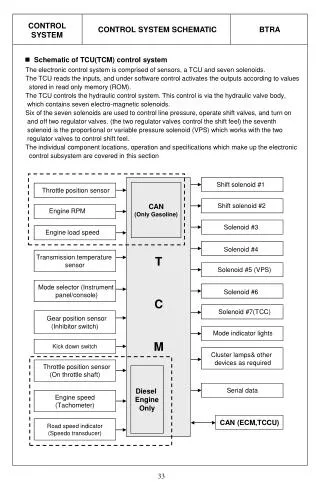
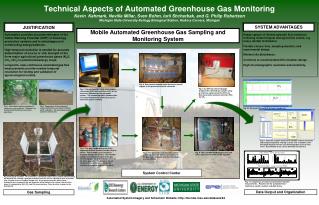
Fig. 1 Automated chambers deployed in continuous corn treatment. Chambers are removed only during necessary farm operations. Fig. 2 Comparison of the automated system (dark boxes) and static chambers (white cylinders). The automated system control is in the trailer. Single flux event Chamber event (four conc.) Single Peak Integration CH4 Fig. 10 Tracing of CH4 and N2O during a chamber run. N2O N2O CH4 Fig. 3 Closing of chambers. At set intervals, a pneumatic signal closes (yellow and blue tubes) the butterfly lids, creating a gastight headspace until the lids are signaled to open 40 minutes later. Clamps assure a complete airtight seal. At ten minute intervals, while closed, headspace gas is pumped to the gas analyzers (white tubing) in the system control center where it is analyzed for N2O, CO2, and CH4 concentrations. Note the static chamber in the background. CO2 Fig. 11 Data flux analyzer allows each chamber event to be viewed and analyzed separately. Placing a cursor over a chamber event (left graph) displays the flux and chromatographic trace for that event. Questionable fluxes can be identified and rejected. Technical Aspects of Automated Greenhouse Gas MonitoringKevin Kahmark, Neville Millar, Sven Bohm, Iurii Shcherbak, and G. Philip RobertsonMichigan State University-Kellogg Biological Station, Hickory Corners, Michigan System Advantages Justification Mobile Automated Greenhouse Gas Sampling and Monitoring System Automation provides accurate estimates of the Global Warming Potential (GWP) of bioenergy production systems and is advantageous in constructing energy balances. High temporal resolution is needed for accurate determination of source or sink strength of the three major agricultural greenhouse gases (N2O, CO2, CH4) in potential bioenergy crops. Long-term, near-continuous automated gas flux measurements provide needed temporal resolution for testing and validation of agroecological models. Ready capture of intense episodic N2O emissions following meteorological and agronomic events, e.g. heavy rainfall, fertilization. Flexible closure time, sampling duration, and experimental design. Minimal site disturbance. Conforms to recommended GHG chamber design. High chromatographic resolution and sensitivity. Fig. 6 Data control modules send electronic (on/off) signals to the pneumatic control solenoids. Fig. 8 An SRI Gas Chromatograph analyzes the collected gas sample using an electron capture detector (ECD) for N2O and a flame ionization detector (FID) for CH4. Fig. 4 Ruby automation code sends digital commands to the data modules which act as electronic switches for the pneumatic system. The chromatographic software runs in a virtual machine that allows the user to check the system remotely. Fig. 5 The gas standards are run at the beginning and end of each chamber closure period. Two chambers are closed and analyzed during each period. The chamber sample is carried by nitrogen to the gas chromatograph. Air and hydrogen serve as the flame gases for CH4 analysis. An air compressor supplies pressure for the chamber pneumatics and injection ports. Static chamber – average daily N2O fluxes Fig. 9 The Licor-840 IRGA analyzes CO2 and water vaporprior to each sample injection. Fig. 7 The pneumatic and injection control center regulates the delivery of samples to the gas chromatograph and the infrared gas analyzer (IRGA). Automated chamber – average hourly N2O fluxes System Control Center Fig. 12 Comparison of static and automated chamber measurements. Results from the automated near-continuous system resolves sub-daily fluxes. Data Output and Organization Gas Sampling Automated System Imagery and Schematic Website: http://lter.kbs.msu.edu/datasets/64