Download
1 / 55
550 likes | 710 Views
Statistics Normal Probability. https://www.123rf.com/photo_6622261_statistics-and-analysis-of-data-as-background.html. Normal Probability. You can think of smooth quantitative data graphs as a series of skinnier and skinnier bars. Normal Probability.

E N D
Statistics Normal Probability https://www.123rf.com/photo_6622261_statistics-and-analysis-of-data-as-background.html
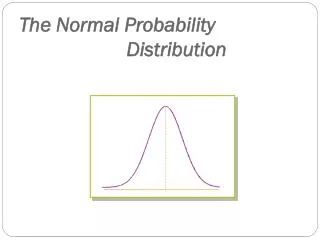
Normal Probability You can think of smooth quantitative data graphs as a series of skinnier and skinnier bars
Normal Probability When the width of the bars reach “zero” the graph is perfectly smooth
Normal Probability SO, a smooth quantitative (continuous) graph can be thought of as a bar chart where the bars have width zero
Normal Probability The probability for a continuous graph is the area of its bar: height x width
Normal Probability But… the width of the bars on a continuous graph are zero, so P = Bar Area = height x zero All the probabilities are P = 0 !
Normal Probability Yep. It’s true. The probability of any specific value on a continuous graph is: ZERO
Normal Probability So… Instead of a specific value, for continuous graphs we find the probability of a range of values – an area under the curve
Normal Probability Because this would require yucky calculus to find the probabilities, commonly-used continuous graphs are included in Excel Yay!
Normal Probability The most popular continuous graph in statistics is the NORMAL DISTRIBUTION
Normal Probability Two descriptive statistics completely define the shape of a normal distribution: Mean µ Standard deviation σ
Normal Probability Suppose we have a normal distribution, µ = 12 σ = 2
Normal Probability If µ = 12 12
Normal Probability If µ = 12 σ = 2 6 8 10 12141618
Normal Probability PROJECT QUESTION Suppose we have a normal distribution, µ = 10 ?
Normal Probability PROJECT QUESTION Suppose we have a normal distribution, µ = 10 σ = 5 ? ? ? ? ? ? ?
Normal Probability Suppose we have a normal distribution, µ = 10 σ = 5 -505 10152025
Normal Probability The standard normal distribution has a mean µ = 0 and a standard deviation σ= 1
Normal Probability PROJECT QUESTION For the standard normal distribution, µ = 0 σ = 1 ? ? ? ? ? ? ?
Normal Probability PROJECT QUESTION For the standard normal distribution, µ = 0 σ = 1 -3-2-10 123
Normal Probability The standard normal is also called “z”
Normal Probability We can change any normally-distributed variable into a standard normal One with: mean = 0 standard deviation = 1
Normal Probability To calculate a “z-score”: Take your value x Subtract the mean µ Divide by the standard deviation σ
Normal Probability z = (x - µ)/σ
Normal Probability IN-CLASS PROBLEMS Suppose we have a normal distribution, µ = 10 σ = 2 z = (x - µ)/σ = (x-10)/2 Calculate the z values for x = 9, 10, 15
Normal Probability IN-CLASS PROBLEMS z = (x - µ)/σ = (x-10)/2 x . 9 z = (9-10)/2 = -1/2
Normal Probability IN-CLASS PROBLEMS z = (x - µ)/σ = (x-10)/2 x . 9 z = (9-10)/2 = -1/2 10 z = (10-10)/2 = 0
Normal Probability IN-CLASS PROBLEMS z = (x - µ)/σ = (x-10)/2 x . 9 z = (9-10)/2 = -1/2 10 z = (10-10)/2 = 0 15 z = (15-10)/2 = 5/2
Normal Probability -3-2-10 123 | | -1/2 5/2
Normal Probability But… What about the probabilities??
Normal Probability We use the properties of the normal distribution to calculate the probabilities
Normal Probability IN-CLASS PROBLEMS What is the probability of getting a z-score value between -1 and 1 -2 and 2 -3 and 3
Normal Probability You also use symmetry to calculate probabilities
Normal Probability IN-CLASS PROBLEMS What is the probability of getting a z-score value between -1 & 0 -2 & 0 -3 & 0 Percentage of the curve z-score
Normal Probability IN-CLASS PROBLEMS What is the probability of getting a z-score value between -1 & 2.5 -0.5 & 3 -2.5 & -1.5 Percentage of the curve z-score
Normal Probability Note: these are not exact – more accurate values can be found using Excel Percentage of the curve z-score
Excel Probability Normal probability values in Excel are given as cumulative values (the probability of getting an x or z value less than or equal to the value you want)
Excel Probability Use the function: NORM.DIST
Excel Probability For a z prob, use: NORM.S.DIST
Excel Probability Excel gives you the cumulative probability – the probability of getting a value UP to your x value: P (x ≤ your value)
Excel Probability How do you calculate other probabilities using the cumulative probability Excel gives you?
Normal Probability IN-CLASS PROBLEMS If the area under the entire curve is 100%, how much of the graph lies above “x”?
Excel Probability P(x ≥ b) = 1 - P(x ≤ b) or = 100% - P(x ≤ b) or = 100% - 90% = 10%
Excel Probability What about probabilities between two “x” values?
Excel Probability P(a ≤ x ≤ b) equals P(x ≤ b) – P(x ≤ a) minus