DRAFT
R:Live FilesIBK ManagementInboxADAIR TURNERln000rsm.ppt 06/11/2003 10:25:00 ( 1 ). Demographics, Economics and Social Choice. ADAIR TURNER. November 6, 2003. CONFIDENTIAL. DRAFT. Table of Contents. Presentation to The Economist. Table of Contents.

DRAFT
E N D
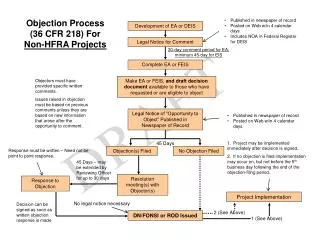
Presentation Transcript
R:\Live Files\IBK Management\Inbox\ADAIR TURNER\ln000rsm.ppt 06/11/2003 10:25:00 (1) Demographics, Economics and Social Choice ADAIR TURNER November 6, 2003 CONFIDENTIAL DRAFT
Table of Contents Presentation to The Economist Table of Contents
Three Dimensions of Demographic Change • Increasing Longevity • Declining Fertility • Baby Boom Cohort
Life Expectancy at Birth(1) - Male ____________________ Source: GAD for UK; United Nations for World Note: These are “Period” Life expectations, which actually underestimate the expected life span of a baby born in the year specified, but which are easier to calculate than the correct “cohort” figures and therefore frequently used in international comparisons. See footnote x in lecture text for explanation
Life Expectancy at 60(1) - Male ____________________ Source: Eurostat demographic year book; GAD for UK Note: On “Period” basis
Total Fertility Rates – Europe and North America 1950-2000 In chart minimum value in y axis is 0.5 and crosses at 0.75 In PowerPoint a white fill box has been used to blank out the 0.5 ____________________ Source: United Nations
Total Fertility Rates – Asian Countries 1950-2000 In chart minimum value in y axis is 0 and crosses at 0. 5 In PowerPoint a white fill box has been used to blank out the 0 ____________________ Source: United Nations
Total Fertility Rates – Iran, Turkey, Brazil, 1950-2020 In chart minimum value in y axis is 0 and crosses at 0. 5 In PowerPoint a white fill box has been used to blank out the 0 1950 and 2020 are text boxes in PowerPoint with a white fill 1950 2020 -55 -65 -75 -85 -95 -05 -15 -25 ____________________ Source: United Nations
B B A A From Pyramids to Columns Age Group 100 + 95 - 99 90 - 94 85 - 89 80 - 84 75 - 79 70 - 74 65 - 69 60 - 64 55 - 59 50 - 54 45 - 49 40 - 44 35 - 39 30 - 34 25 - 29 20 - 24 15 - 19 10 - 14 5 - 9 0 - 4
Average retirement income Working years No population growth = Average worker contribution Retired years No productivity growth Implicit rate of return on contributions = 0 Population growth positive R. I. W. Y. Population growth * = No productivity growth W. C. R. Y. Rate of return = Population growth rate Population growth positive R. I. W. Y. * Population growth * Productivity growth = Productivity growth positive W. C. R. Y. Rate of return = population growth rate + productivity growth rate P.A.Y.G. Pension Systems: Key Ratios
Demographic Drivers of Support Ratio No. of Workers No. of Retired Working Years Retired Years “Support Ratio” Population Growth * = =
Support Ratio Forecasts 2000-2050 Ratio of 20-64 Year Olds to 65+ ____________________ Source: UN Medium Variant
P.A.Y.G. Schemes: Three Alternatives • If support ratios for any given retirement ages fall, then three possible solutions • Increased retirements ages • Poorer pensioners • Bigger worker contributions
Support Ratio Dynamics under Different Demographic Challenges
Are Funded Systems Different? • In any pension system today’s pensioners are dependent on resource transfer from today’s workers • Funded systems only help overcome demographic challenges if they increase savings – in current and future generations • Funded systems face demographic risks • The implications are closely similar for funded and non-funded systems
60+ 15-59 0-15 Years Roy Waterhouse 26-8-03:MS Graph charts. This time, they have been doneas Stacked Bar charts, the X-axisrunning from 0% to 100%. To achieve the appearance of the charts, they are donein three rows, with the middleone containing the ‘real’ dataBlank values of equal amountsare put in either side (with thecolours changed to white),and the whole rowadds up to 100(see screen dump right). The bars then have to bere-coloured manually . The Legend is donemanually. Demographic Change in UK and China – UN Medium Variant % Population by Age Band 2000 2050 UK China ____________________ Source: OECD Historical Statistics: OECD Economic Outlook
Demographic Conditions and Investment Attractiveness ____________________ * Projection per UN Medium Variant
Immigration Only Responses – UN Migration Scenario • To maintain the ratio of 15-64 year olds to 65+ year olds constant requires:
Rising Longevity, Fixed Retirement Age and Stable Support Ratios RetirementAge Initial Structure PlusRising Longevity Plus Immigration to Keep Support Ratio Constant
Europe and Its Neighbours – Population Millions Russia,Ukraine & Belarus European Union EasternEurope WesternAsia* Africa ____________________ Source: UN Medium Variant * Note: UN definition plus Pakistan, Afghanistan and Iran
Population Density – US and Europe 000s per Sq.km: 2000 ____________________ Source: GAD
Age Band 80-100 60-80 40-60 20-40 0-20 1970 2000 2050 Italy’s Population Structure 1970-2050 Millions ____________________ Source: U.N. Medium variant for 2050 projection
Fertility Intentions of Women England & Wales
European Fertility Rates - 2001 ____________________ Source: GAD