Mastering Repeated Measures Designs: An Overview with T-Tests and ANOVA Explanations
330 likes | 364 Views
Dive into the world of Repeated Measures Designs with this comprehensive guide covering bi-level designs, within-subject t-tests, 1-Way ANOVA, and more. Learn about the advantages and techniques involved in analyzing data using SPSS and Excel.

Mastering Repeated Measures Designs: An Overview with T-Tests and ANOVA Explanations
E N D
Presentation Transcript
Outline of Today’s Discussion • Introduction to Repeated Measures Designs • Repeated Measures: Bi-level Designs & t-tests • Within Subject t-tests in Excel and SPSS • Repeated Measures Designs: 1-Way ANOVA • Within-Subject ANOVAs [Basic Ratios]
Part 1 Introduction To Repeated Measures Designs
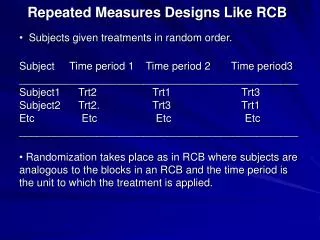
About Repeated Measures Designs • Note these synonyms: Between-subjects design Independent groups designWithin-subjects design Repeated measures design • Potential Pop Quiz Question: In your own words, contrast a repeated measures design with an independent groups design. • Potential Pop Quiz Question: What is the primary advantage of a repeated measures design?
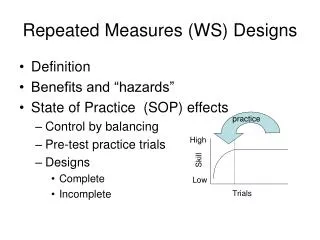
About Repeated Measures Designs • Potential Pop Quiz Question: Psychologists use the phrase “practice effects” in a very particular way. Notably, practice effects could lead to improvements or impairments in behavior. Explain why this is. • Counterbalancing can control practice effects! • Potential Pop Quiz Question: On the topic of counterbalancing, explain the difference between complete and incomplete designs.
About Repeated Measures Designs Sackeim et al., 1978) Potential Pop Quiz Question: Explain how block randomization applies to repeated measures designs.
About Repeated Measures Designs • Potential Pop Quiz Question: Explain what an ABBA design is? • Potential Pop Quiz Question: In your own words, when might an ABBA design be more advantageous than block randomization? • Potential Pop Quiz Question: In your own words, explain the problem of anticipation effects within the context of ABBA designs?
About Repeated Measures Designs • Potential Pop Quiz Question: Identify the two ways in which a Latin Square balances practice effects. • Potential Pop Quiz Question: Explain the problem of differential transfer. Also, what is the best solution to this problem? Latin Square
Part 2 Repeated Measures: Bi-Level Designs & T-Tests
Repeated Measures: T-Tests • We’ve previously used formulas pertaining to the independent samples t-tests, i.e., for between-subjects designs. • There is a separate formula for t-tests that are performed on within-subjects data sets. • This statistic is called either a “repeated measures t-test”, or equivalently, a “within-subjects t-test”…
Repeated Measures: T-Tests Formula for the repeated measures “t” statistic Let’s zoom in on the two components…
Repeated Measures: T-Tests Numerator term in the repeated measures “t” statistic “Difference scores” are obtained on each participant (i.e., condition A score - condition B score), then you sum those up and divide by N…the number of participants.
Repeated Measures: T-Tests Denominator term in the repeated measures “t” statistic Standard error of the difference scores.
Repeated Measures: T-Tests Degrees of Freedom for the repeated measures “t” statistic df = N - 1 Where N equals the number of participants, or equivalently, the number of pairs of scores.
Repeated Measures: T-Tests • There is only one assumption underlying the repeated-measures “t” statistic… • The population distribution of difference scores (D) must be Gaussian. • For now, we will not consider the extent to which the “t” statistic is “robust” to violations of that assumption. • What are the pros & cons of within-subject designs, again?
Part 3 Within Subjects T-Tests In Excel & SPSS
Formulas For The Within-Subject T-Test df = N - 1 Where N equals the number of participants, or equivalently, the number of pairs of scores.
Repeated Measures T-Tests: Excel & SPSS • Here are the steps for conducting a within-subjects t-test in SPSS. • Analyze Compare Means Paired Samples T-Test: • From the variable list in the left box, move pairs of variables to the “Paired Variables’” box on the right
Part 4 Repeated Measures Designs One-Way ANOVA
Repeated Measures Designs: 1-Way ANOVA • The between-subject and within-subject ANOVAs are similar to each other. • However, now the numerator will correspond to the variance between conditions (not between groups of participants). • Similarly, the denominator will correspond to the variance within conditions (not within groups…since there is only one group)…
Repeated Measures Designs: 1-Way ANOVA The F-Ratio For Within-Subject Designs Here, the variances aren’t equal F ratio > 1, F ratio = 4.07
Repeated Measures Designs: 1-Way ANOVA • For any ANOVA (i.e., between-subjects or within-subjects) the denominator is called the error term. • Good experimentalists (like you!) always want to reduce error. • The advantage in using within subjects designs is that we can legitimately reduce the error term by removing consistent individual differences…
Repeated Measures Designs: 1-Way ANOVA • In other words, the fact that “Homer” is consistently worse than “Bart” is not of interest to scientists (although it may be of interest to Homer and Bart). • The repeated measures ANOVA allows us to quantify this unwanted (and irrelevant) source of variability, and remove it. • This gives us more statistical power. What does that mean?
Repeated Measures Designs: 1-Way ANOVA The F-Ratio For Within-Subject Designs The red area can be reduced, leaving a larger proportion of green. F Ratio = MS between / MS within
Repeated Measures Designs: 1-Way ANOVA The F-Ratio For Within-Subject Designs As F grows, it is easier to “beat” the “number to beat”… the critical value. F Ratio = MS between / MS within
Part 5 Within Subjects ANOVAs [Basic Ratios]
Within Subjects ANOVAs [Basic Ratios] • Great News! (Even better than a pop quiz.) • The basic ratios for the between-subjects case can be used in the within-subjects case, too. • We just need to add one new basic ratio. • Question: What is the major advantage of the within-subjects design?
Within Subjects ANOVAs [Basic Ratios] • So, we need a basic ratio that represents to the consistent individual differences among the subjects… • We’ll call it [S]. • We can remove [S] from the denominator of the F ratio, and that will give us more statistical power!
The basic ratio for consistent subject differences is [S]. Within-Subjects One-Way ANOVA [S] [S] = The sum of the squared row totals, divided by # of conditions (a). (Square them first, then sum them.) Each row total corresponds to a different subject.
[S] = The Sum Squared Row Totals divided by # of conditions. Introduction To Basic Ratios ] [S] = The sum of these divided by 4 (conditions)
Within Subjects ANOVAs [Basic Ratios] • Now let’s see how our new basic ratio [S] is used in the F-Summary table. • Remember, we use the within-subjects design to remove consistent individual differences (i.e., make the denominator smaller, so the F ratio becomes bigger)…
Within-Subjects One-Way ANOVA The F Table using basic ratios Using Basic Ratios Here’s [S] The new ‘error’ (a x s) reflects all 4 basic ratios.