Download
1 / 24
240 likes | 377 Views
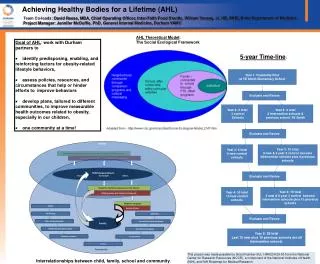
National Child Measurement Programme. Lewisham 2008/09 Results 15 th April 2010. Overview. 2008/09 results Comparison between 2007/08 and 2008/09 results Obese prevalence –school charts School progress 2007/08 and 2008/09 How we use these results- the way forward Summary. Data 2008/09.

E N D
National Child Measurement Programme Lewisham 2008/09 Results 15th April 2010
Overview 2008/09 results Comparison between 2007/08 and 2008/09 results Obese prevalence –school charts School progress 2007/08 and 2008/09 How we use these results- the way forward Summary
Data 2008/09 Participation rate 93% (target 85%; national 90%) R - 2908 children measured Yr 6 - 2497 children measured Definitions used for screening purposes Overweight above 85th centile of the UK1990 distribution Obese above 95th centile of the UK1990 distribution
Headline results London had highest rate of obesity at SHA level In both R and Y6 Lewisham’s rate was similar to London and statistically significantly higher than England In R percentage of obese children rose from 10.6% (2007/08) to 12.0% (2008/09), but this is not statistically significant In Y6 percentage of obese children fell from 25.3% (2007/08) to 22.1% (2008/09), close to statistical significance
Comparative analysis Need to remember: 2 years data not sufficient to determine trends Classes in 2007/08 and 2008/09 were different groups of children, so the analysis will not be comparing the same cohorts When comparing schools high proportion (percentages) do not necessarily mean large numbers if overall class size is small
Obese prevalence – school charts
Primary schools by year 6 population size, with weight categories
Obesity prevalence -deprivation and ethnicity Nationally strong link between deprivation and obesity prevalence in children in both R and Y6 In Lewisham link between deprivation and obesity observed but accounts for only about 3.3% of the variation (due to spread of deprivation in borough) Nationally obesity prevalence significantly higher in R and Y6 in the ethnic groups: Asian or Asian British, any other ethnic group and Black or Black British and significantly lower in R and Y6 in Chinese and White In Lewisham no statistically significant difference observed in prevalence of obesity between ethnic groups
Y6 proportion obese by Lower Super Output Area and school collaborative
Comparison of schools 2007/08 & 2008/09 Of the 66 primary schools 42 recorded reductions in Y6 obesity rates including all of the highest 25% in 2007/08 There was no correlation between ranking of schools by Y6 obesity rates between 2007/08 and in 2008/09
Y6, 20 schools with the biggest reduction in % obese 2007/08 - 2008/09
Y6, 20 schools with the biggest increase in % obese 2007/08 - 2008/09
How do we use these results? There was no correlation between ranking of schools by Y6 obesity rates between 2007/08 and in 2008/09 School ranking different if we look at proportions or number of children over healthy weight - 8 schools with % over healthy weight in top 20 for both R and Y6 - 13 schools with n over healthy weight in top 20 for both R and Y6 But only 4 schools in both lists… Work with primary collaboratives?
Summary High levels of childhood obesity in Lewisham, 12.0% of R and 22.1% of Y6 children obese 25.2% of R and 37.3% of Y6 children either overweight or obese 2 years data not sufficient to determine trends When comparing schools, high proportion (percentages) do not necessarily mean large numbers if overall class size is small Sub group to meet to discuss how we use these results at school or collaborative level