Download
1 / 18
210 likes | 531 Views
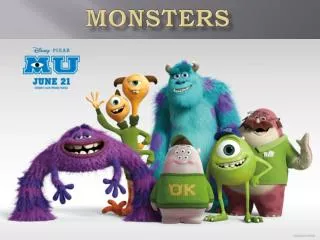
Monsters University Cheez -Its. Alexandra Smith & Kalyn Potter. Monsters University Preview. Main Characters on C heez -Its. Secondary Characters on C heez -Its. Data Collection. Organized by the image displayed on the face of the Cheez -It Univariate Q ualitative

E N D
Monsters University Cheez-Its Alexandra Smith & Kalyn Potter
Data Collection • Organized by the image displayed on the face of the Cheez-It • Univariate • Qualitative • We collected six data points • because there were six • different images that were • printed on the Cheez-Its
Stem & Leaf Plot • 4 24 • 5 026 • 6 2 Ones Tens
Box Plot Monsters University Cheez-Its
Chebychev Graph Monsters University Cheez-Its Empirical Rule 68% of the data between 43.55 and 58.45 95% of the data between 36.1 and 65.9 99.7% of the data between 28.65 and 73.35
Measures of Center Mean: 51 Median: 51 Mode: Art (20% of data)
Measures of Dispersion Range: 20 Standard Deviation: 7.45 5 Number Summary: Minimum: 42 Q1: 44 Median: 51 Q3: 56 Maximum: 62 Outlier Analysis (with fences): 3Q - 1Q= IQR 56 - 44= 12 12 X 1.5= 18Lower Fence: 44 - 18= 26 Upper Fence: 56 + 18= 74
Z- Scores • Monsters Inc. Symbol: 52 – 51 / 7.45= .1342 • Randy: 42 – 51 /7.45= -1.208 • Art: 62 – 51 /7.45= 1.4765 • Squishy: 56 – 51 /7.45= .6711 • Mike: 50 – 51 /7.45= -.1342 • Sulley: 44 – 51 /7.45= -.9395
Distribution Evidence • Stem and leaf plot shows data is normal • Histogram is pareto because we have qualitative data • Pie graph shows secondary characters appear more than main • Dot plot shows the range • Mean and median are equal
Summary • The data was spread out pretty evenly- no big gaps between characters • Data showed that secondary characters occurred more than the main characters • We originally expected that Mike or Sulley • would appear the most on the Cheez-Its • Next time, we would choose food with less quantity.
Bibliography • Rizvi, Samad. "‘Monsters University’ Director Dan Scanlon” The Pixar Times. N.p., 24 Apr. 2013. Web. 13 Nov. 2013. • Chanel, Sunny. "Monsters University: 10 Life Lessons." Babble RSS. Disney, 21 June 2013. Web. 15 Nov. 2013. • Breznican, Anthony. "'Monsters University': Pixar." EW.com. Entertainment Weekly, 27 June 2013. Web. 15 Nov. 2013.