Download
1 / 1
10 likes | 85 Views
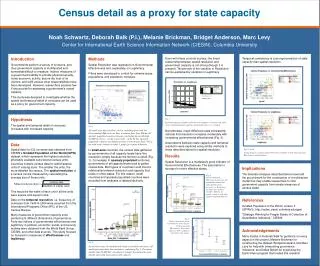
Explore how census spatial and temporal detail can be used to measure government capacity. Findings show spatial resolution moderately indicates Governmental Effectiveness. Temporal consistency is a stronger predictor. Study excludes small and sparsely populated countries.

E N D
Census detail as a proxy for state capacity Noah Schwartz, Deborah Balk (P.I.), Melanie Brickman, Bridget Anderson, Marc Levy Center for International Earth Science Information Network (CIESIN), Columbia University Introduction Governments perform a variety of functions, and thus government capacity is multifaceted and somewhat difficult to measure. Indirect measures of a government’s ability to provide physical security, foster economic activity, secure the trust of its citizens, and fulfill various other responsibilities have been developed. However, researchers possess few if any proxies for assessing a government’s overall capacity. This study was designed to investigate whether the spatial and temporal detail of censuses can be used as a proxy for government capacity. Methods Spatial Resolution was regressed on Governmental Effectiveness and, separately, on Legitimacy. Filters were developed to control for extreme areas, populations, and population densities. Even with these controls in place, the linear relationship between spatial resolution and government capacity is not strong (though it is present). Ten percent of the variation in Resolution can be explained by variation in Legitimacy. Temporal consistency is a stronger predictor of state capacity than spatial resolution. Hypothesis The spatial and temporal detail of censuses increases with increased capacity. Fig. 3 Resolution improves slightly with increased legitimacy. Countries with small areas, small populations, and large uninhabited areas were excluded. Fig. 1 All small-area states (hollow circles), including those with low Governmental Effectiveness, have resolution finer than 100 km. All sparsely populated countries (orange), including those with high GovEff, lie above – on the coarser side – of the fit line. Sparsely populated countries are defined as those in which more than 75% of the total area contains less than 5 people per square kilometer. Nevertheless, mean difference tests consistently indicate that resolution increases moderately with increasing governmental effectiveness (Fig. 5). Associations between state capacity and temporal resolution were explored using similar methods to those described above for spatial resolution. Results Spatial Resolution is a moderately good indicator of Governmental Effectiveness. The association is stronger for more effective states. Data Spatial data for 232 countries was obtained from CIESIN’s Gridded Population of the World (GPW) dataset, which represents the highest resolution, affordably available sub-national census units. Countries compile census data for administrative units of varying sizes. The smaller the units, the more detailed the census. The spatial resolution of a census can be measured by calculating the average size of these units: This would be the width of each unit if all the units were square and equal in size. Data on the temporal resolution, i.e. frequency, of censuses from 1940 to 2004 were acquired from the International Programs Office (IPC) of the US Census Bureau. Many measures of government capacity exist, pertaining to different dimensions of governance. Forty-two indices of governmental effectiveness and legitimacy in political, economic, social, and security matters were obtained from the World Bank Group, CIESIN, and other data sources. This study focused on focused on measures of effectiveness and legitimacy. In small-area countries, the census data gathered by governments of all capacity levels have fine resolution, simply because the territory is small (Fig. 1). Conversely, in sparsely populated territories, governments of all capacity levels tend to gather coarse data. Both types of countries could cloud a relationship between resolution and capacity that exists in other states. For this reason, small countries and sparsely populated countries were excluded from analyses or labeled distinctly. Figs. 5 and 6 Census frequency explains about 30% of the variability in both Governmental Effectiveness and Legitimacy. Implications The bivariate analyses described above have laid the ground work for the construction of a multivariate model that may enable researchers to infer government capacity from simple measures of census detail. Fig. 4 As Governmental Effectiveness increases, the median Resolution and inter-quartile range decrease, i.e. Resolution becomes finer and less variable. Outliers are mainly countries with large, sparsely-populated deserts References Gridded Population of the World, version 3 (GPWv3), http://sedac.ciesin.columbia.edu/gpw. “Strategic Warning for Fragile States: A Collection of Quantitative Indicators,” CIESIN. Fig. 5 Points represent the mean resolution for each category of Governmental Effectiveness. Error bars represent 95% confidence intervals for the means. Acknowledgements Many thanks to Deborah Balk for guidance on every aspect on this project; Melanie Brickman for constructing the dataset; Bridget Anderson and Marc Levy for help with interpreting governance indicators; and Dallas Abbott for organizing the Earth Intern program that funded this research. Fig. 2 As area decreases, the median and range of resolution decreases. All small-area states have fine resolution, confirming Fig. 1. For states smaller than 50,000 km2, resolution is strongly determined by area, thereby obscuring associations with capacity.