Download
1 / 53
560 likes | 806 Views
PRODUCTION & OPERATION MANAGEMENT. PRODUCT DESIGN TOOLS By PRAMOD KUMAR BISWAL PRAFUL KUMAR YASHPAL SINGH RAHUL KUMAR. PRODUCTION & OPERATION MANAGEMENT. PRODUCT DESIGN TOOLS QUALITY FUNCTION DEPLOYMENT VALUE ANALYSIS THE TAGUCHI METHOD COMPUTER AIDED DESIGN

E N D
PRODUCTION & OPERATIONMANAGEMENT PRODUCT DESIGN TOOLS By PRAMOD KUMAR BISWAL PRAFUL KUMAR YASHPAL SINGH RAHUL KUMAR
PRODUCTION & OPERATION MANAGEMENT PRODUCT DESIGN TOOLS QUALITY FUNCTION DEPLOYMENT VALUE ANALYSIS THE TAGUCHI METHOD COMPUTER AIDED DESIGN DESIGN FOR MANUFACTURABILITY AND DESIGN FOR ASSEMBLY & PROTOTYPING
PRODUCT DESIGN TOOLS • THE MAIN OBJECTIVE OF A PRODUCT DESIGNER IS - • TO REDUCE PRODUCTION COST. • TO DECREASE PRODUCT DEVELOPMENT TIME. • TO IMPROVE QUALITY OF THE PRODUCT . • SEVERAL TOOLS AND METHODS HAVE BEEN DEVELOPED TO HELP A PRODUCT DESIGNER TO IMPROVE PRODUCT QUALITY AT A LOWER COST.
PRODUCT DESIGN TOOLS • AN IMPORTANT ASPECTS OF PRODUCT DESIGN IS TO IDENTIFY CUSTOMERS PREFERENCE WITH RESPECT TO PRODUCT FEATURES AND CONVERT THEM INTO APPROPRIATE TECHNICAL AND DESIGN ATTRIBUTES. • A STRUCTURED METHOD(QFD) FOR DOING THIS WAS FIRST DEVELOPED BY PROFESSOR YOJI AKAO IN JAPAN IN 1966.
QUALITY FUNCTION DEPLOYMENT • QUALITY FUNCTION DEPLOYMENT (QFD) IS A “METHOD TO TRANSFORM USER DEMANDS INTO DESIGN QUALITY, TO DEPLOY THE FUNCTIONS FORMING QUALITY, AND TO DEPLOY METHODS FOR ACHIEVING THE DESIGN QUALITY INTO SUBSYSTEMS AND ITS COMPONENTS, AND ULTIMATELY TO SPECIFIC ELEMENTS OF THE MANUFACTURING PROCESS.” [
CONTD…. • FIRST CONCEPTUALIZED IN 1966 AS A METHOD OR CONCEPT FOR NEW PRODUCT DEVELOPMENT BY PROFESSOR YOJI AKAO. • QUALITY FUNCTION DEPLOYMENT (QFD) IS USED TO TRANSLATE CUSTOMER REQUIREMENTS TO ENGINEERING SPECIFICATIONS • IT FORMS A LINK BETWEEN CUSTOMERS - DESIGN ENGINEERS - COMPETITORS - MANUFACTURING.
CONTD….. • IT IS VERY MUCH POWERFUL AS IT INCORPORATES THE VOICE OF THE CUSTOMER IN THE DESIGNS - HENCE IT IS LIKELY THAT THE FINAL PRODUCT WILL BE BETTER DESIGNED TO SATISFY THE CUSTOMER'S NEEDS • QFD IS APPLIED IN THE EARLY STAGES OF THE DESIGN PHASE SO THAT THE CUSTOMER WANTS ARE INCORPORATED INTO THE FINAL PRODUCT
QUALITY FUNCTION DEPLOYMENT QFD HELPS DESIGNER IN:- • UNDERSTANDING 'TRUE' CUSTOMER NEEDS FROM THE CUSTOMER'S PERSPECTIVE . • UNDERSTANDING HOW CUSTOMERS OR END USERS BECOME INTERESTED, CHOOSE, AND ARE SATISFIED. • ANALYZING HOW DO WE KNOW THE NEEDS OF THE CUSTOMER
CONTD….. • DECIDING WHAT FEATURES TO INCLUDE . • DETERMINING WHAT LEVEL OF PERFORMANCE TO DELIVER . • HENCE IT LINKS THE NEEDS OF THE CUSTOMER WITH DESIGN, DEVELOPMENT, ENGINEERING, MANUFACTURING, AND SERVICE FUNCTIONS .
PHASES OF QFD • A COMPREHENSIVE QFD INVOLVE FOUR PHASES: • PRODUCT PLANNINGTRANSLATE CUSTOMER REQUIREMENT INTO PRODUCT TECHNICAL REQUIREMENTS TO MEET THEM. • PRODUCT DESIGN TRANSLATE TECHNICAL REQUIREMENTS TO KEY PART CHARACTERISTICS OR SYSTEMS
CONTD…. • PROCESS PLANNING IDENTIFY KEY PROCESS OPERATIONS NECESSARY TO ACHIEVE KEY PART CHARACTERISTICS. • PRODUCTION PLANNING (PROCESS CONTROL): ESTABLISH PROCESS CONTROL PLANS, MAINTENANCE PLANS, TRAINING PLANS TO CONTROL OPERATIONS.
VALUE ANALYSIS • HISTORY:- • THE CONCEPT OF VALUE ANALYSIS WAS CONCEIVED DURING WORLD WAR II AT GENERAL ELECTRIC COMPANY BY LAWRENCE MILES TO FIND AN ACCEPTABLE SUBSTITUTE FOR SHORTAGE OF SKILL LABOURS AND RAW MATERIALS. • THERE IT WAS NOTICED THAT THESE SUBSTITUTION OFTEN REDUCED COST,IMPROVED PRODUCT AND BOTH. • SO WHAT STARTED OUT AS AN ACCIDENT OF NECESSITY WAS TURNED INTO A SYSTEMATIC PROCESS WHICH IS NOW REFERRED AS VALUE ANALYSIS.
WHAT IS VALUE ? • THE VALUE OF PRODUCT WILL BE INTERPRETED IN DIFFERENT WAY BY DIFFERENT CUSTOMER . • IN GENERAL VALUE CAN BE EXPRESSED AS MAXIMISING THE FUNCTION OF A PRODUCT IN RALATION TO ITS COST.SO , • VALUE=(PERFORMANCE+CAPABILITY)/COST= FUNCTION/COST
WHAT IS VALUE ANALYSIS • VALUE ANALYSIS PRIMARILY FOCUSSED ON THE FUNCTION OF A PRODUCT RATHER THAN ITS STRUCTURE OR FORM. FURTHER IT TRIES TO MAXIMIZE THE ECONOMIC VALUE OF A PRODUCT/COMPONENT WITH RESPECT TO ITS COST.
SOME IMPORTANT ASPECTS OF VALUE ANALYSIS • THE USE OF MULTIDISCIPLINARY TEAM(OP,MKT,SALE,CUSTOMER,SUPPLIER) • SYSTEMATIC PROCEDURE FOR EVALUATING PRODUCT FUNCTIONALITY AND VALUE. • FOCUS ON PRODUCT SIMPLIFICATION
PROCESS/STEPS OF VALUE ANALYSIS • PROCESS BEGINS WITH ANALYSING THE PRODUCT AS A WHOLE AND THEN EACH SUB ASSEMBLY IF NECESSARY.A SERIES OF QUESTIONS ARE USED TO GUIDE PROCESS AT EACH STEPS.
STEP I • THE FIRST STEP IS TO SPECIFY THE FUNCTION OF PRODUCT. THE TYPICAL QUESTIONS HERE MIGHT BE :- • WHAT IS THE PRODUCT OR COMPONENT ? • WHAT IS ITS FUNCTION ? • WHAT CHARACTERISTICS ARE OF VALUE TO THE CUSTOMER ? • HOW WILL THE CUSTOMER USE THE PRODUCT? • THE ANSWER OF THE ABOVE QUESTION WILL REVEAL CORE OF A PRODUCT.
STEP II • IN SECOND STEP ANALYSIS IS DONE TO DETERMINE HOW EACH PRODUCT CHARACTERISTICS OR COMPONENT CONTRIBUTES TO ITS VALUE(FUNCTIONALITY) AND ALSO TO DETERMINE WHAT EACH COMPONENT COSTS. • TYPICAL QUESTION HERE COULD BE HOW DOES THIS COMPONENT CONTRIBUTE TO FUNCTIONALITY ? • HOW DOES IT INCREASE THE PRODUCT VALUE ? • WHAT DOES IT COST ?
STEP III • THIRD AND FINAL STEP IS THE CREATIVE PHASE OF VALUE ANALYSIS. • HERE WE REDESIGN PRODUCT OR COMPONENT TO REDUCE ITS COST OR IMPROVE ITS VALUE. • HERE FOCUS IS MAINLY ON SIMPLIFYING THE DESIGN AND EVALUATING APPROPRIATENESS OF PRODUCT SPECIFICATION USING THESE QUESTIONS.
CONTD….. • CAN THIS BE DONE ANOTHER WAY ? • CAN THIS BE DONE MORE CHEAPLY ? • CAN A DIFFERENT MATERIAL BE USED ? • CAN THIS PRODUCT BE MADE EASIER TO ASSEMBLE ? • CAN THE ITEM FUNCTION BE COMBINED WITH THAT OF ANOTHER COMPONENT ? • HERE THE ANSWER REPRESENTS DESIGN ALTERNATIVES THAT CAN BE COMPARED AND EVALUATED IN TERMS OF THEIR VALUE AND COST.
APPLICATION • HONDA’S ACCORD DESIGN OF YEAR 1994 IS ONE OF THE FINEST APPLICATION OF VALUE ANALYSIS.
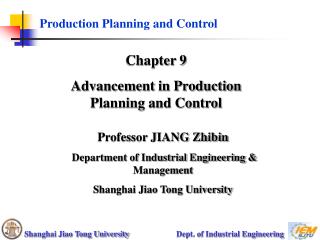
THE TAGUCHI METHOD • The Taguchi method is one of the most popular tools used in robust design. Taguchi’s approach is based on three principles: 1. when the value of a product attribute, such as shape or length, deviates from its target value, the cost of society (in term of consumer and producers) in terms of lower quality increase more than linearity (increase at an increasing rate.
THE TAGUCHI METHOD socialcost Product attributes Target value
THE TAGUCHI METHOD 2. The design feature of the product and production process together determine the amount of variation in the product attributes. 3.Using experimentation, those product and process characteristics that affect product attributes can be determined and by manipulating these characteristic, product can be designed to reduce the attribute variations that result from normal production variations.
THE TAGUCHI METHOD To illustrate Taguchi’s approach, consider the production of metal sheets that require a very smooth , uniform 0.005 inch coating of plastic. PROCESS: the production process involves passing the metal sheets through a bath of liquid plastic and then through an oven to dry. The type of metal and plastic used(product design feature) and the temperature of the plastic, time of bathing and drying temperature and time (process design feature) will affect the thickness, uniformity, and smoothness of the coating . .
THE TAGUCHI METHOD With this tool we experiment with different product and process design characteristic to determine the best combination that produces the least variation in product quality under normal production conditions. We consider the effect of two product design feature type of plastic used P1=low viscosity plastic P2=high viscosity plastic Surface quality of metal M1 , M2
THE TAGUCHI METHOD Sur and viscosity At fixed metal surface quality Resulting Variation in SUR SUR Normal variation In plastic viscosity P1 P2 Plastic type viscosity
THE TAGUCHI METHOD Sur and metal quality At fixed plastic viscosity S U R Metal surface quality M1 M2
THE TAGUCHI METHOD Suppose target level of coating smoothness and uniformity can be obtained by using the plastic/metal combination P2M1 orP1M2 here P2M1 produces less variation Because (1) SUR is very sensitive to P1 but insensitive to P2 (2) the sensitivity of SUR to metal surface is relatively constant for M1 & M2
THE TAGUCHI METHODf.d. frequency P2M1 P1M2 SUR target
THE TAGUCHI METHOD The difficulty with this method is that if there are several product and process features, no of alternative will be more no. of expriment will be large.
THE TAGUCHI METHOD The Taguchi analysis can be extended to studying the relationship between process characteristics such as belt speed (drying time) ,temperature and SUR e.g. low-temp , low-speed drying may produce less variation in coating smoothness and uniformity than high-temp, high-speed drying.
Robust Parameter Design • Taguchi divided the factors affecting any system into two categories - control factors and noise factors. Control factors are factors affecting a system that are easily set by the experimenter. For example, if in a chemical process the reaction time is found to be a factor affecting the yield, then this factor is a control factor since it can be easily manipulated and set by the experimenter. The experimenter will choose the setting of the reaction time that maximizes the yield. Noise factors are factors affecting a system that are difficult or impossible to control. For example, ambient temperature may also have an effect on the yield of a chemical process, but ambient temperature could be a noise factor if it is beyond the control of the experimenter. Thus, change in ambient temperature will lead to variations in the yield but such variations are undesirable
Inner and Outer Arrays Taguchi studied the interaction between the control and noise factors using two experiment designs - the inner array and the outer array. The inner array is essentially any experimental design that is used to study the effect of the control factors on the response. Taguchi then used an outer array for the noise factors so that each run of the inner array was repeated for every treatment of the outer array. The resulting experiment design, that uses both inner and outer arrays, is referred to as a cross array.
CASE • Customer specification Height: 11-13in Width : 8-10 in Thickness: 2.5-3.5 in Total volume: >= 324 q in Burst strength: >= 100 lbs Puncture rating: >= 6 Printing: 2 rotogravure Quality: rotogravure or lithograph
Current product characteristic Height: 11.5in Width : 9.5 in Thickness: 3.0 in Total volume: 327.75 q in Burst strength: >= 105lbs Puncture rating: >= 6.2 Printing: 2 rotogravure Paper board stock: grade C 80% recycled fiber
New product characteristic Height: 11.0 in Width : 9.5 in Thickness: 3.25 in Total volume: >= 330.69 q in Burst strength: >= 115 lbs Puncture rating: >= 6.7 Printing: 2 rotogravure Paper board stock: grade B 80% recycled fiber
THE TAGUCHI METHOD • The material cost gone up • Labor cost and machine time dropped • So overall cost was lower • After testing the carton new product found to be of superior quality as : faster filling, less spilling, larger volume and stronger pack.
Computer aided design Computer aided design involves any type of design activity which makes use of computer to develop , analyze , or modify an engineering design .modern CAD system are based on interactive computer graphics (ICG). Interactive computer graphics denotes a user oriented system in which computer is employed to create ,transform and display data in the form of symbol .
The user in the computer graphics design system is designer , who communicates data and commands to the computer through input device . The computer communicates with the user via a cathode ray tube (CRT) the designer create an image on CRT screen by entering commands to call the desired software subroutines stored in the computer .
REASONS FOR IMPLEMENTING CAD • 1. To increase the productivity of the designer. • 2 To improve the quality of design. • 3 To improve the communication. • 4 To create a database for manufacturing.
THE DESIGN PROCESS • The design process consist of six identifiable steps or process. • 1 .Recognition of need. • 2. Definition of problem • 3. Synthesis. • 4.Analysis and optimization. • 5.Evaluation. • 6.presentation.
THE APPLICATION OF COMPUTERS FOR DESIGN • The various design related task which are performed by a modern CAD system can be grouped into four functional areas: • 1. Geometric modeling • 2. Engineering analysis • 3. Design review and application • 4. Automated drafting
1. Geometric modeling • In CAD geometric modeling is concerned with computer compatible mathematical description of the geometry of an object. The mathematical description allow the image of the object to be displayed and manipulated on a graphic terminal through signals from the CPU and CAD system. There are several methods of representing the object in geometric modeling . The basic form uses wire frames to represent the object. In this form the object is displayed by interconnecting lines.
THE APPLICATION OF COMPUTERS FOR DESIGN • Wireframe geometric modeling is classified into three types .the three types are: • 1.2D Two dimensional representation is used for flat object. • 2 . 2 ½ D This goes somewhat beyond 2d capability by permitting a three –dimensional object to be represented as long as it has no side –wall details. • 3. 3D. This allows for full three –dimensional modeling of a more complex geometry.
ENGINEERING ANALYSIS • The engineering analysis may involve stress-strain calculation , heat transfer computation, or the use of differential equations to describe the dynamic behavior if the system being designed.
DESIGN REVIEW AND EVALUATION • One of the most interesting evaluation features available on some CAD system is kinematics. The available kinematics packages provide the capability to animate the motion of simple design mechanism such as hinged component and linkages. This capability enhances the designers visualization of the operation of the mechanism and help to ensure against interference with other components.
AUTOMATED DRAFTING • Automated drafting involves the creation of hard copy engineering drawing directly from CAD data base. This is the principal justification for investing in CAD system. It can increase productivity in the drafting function by roughly five times over manual drafting.
PART CLASSIFICATION AND CODING • In addition to the four CAD functions described above , another feature of CAD data base is that it can be used to develop a part classification and coding system. Parts classification and coding involves the grouping of part designs into classes ,and relating the similarities by means of coding scheme . Designers can use the classification and coding system to retrieve existing part design rather than always redesigning new parts.