Download
1 / 26
260 likes | 373 Views
Brief evaluation of REMAD and CMAQ for east Texas tracers. Mark Green, DRI Model results from Christian Seigneur and Betty Pun- AER (CMAQ and REMSAD), and Mike Barna- CIRA (REMSAD). Methodology.

E N D
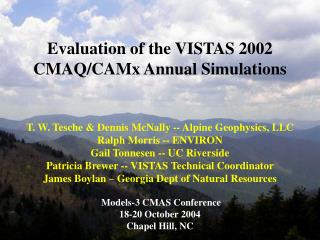
Brief evaluation of REMAD and CMAQ for east Texas tracers Mark Green, DRI Model results from Christian Seigneur and Betty Pun- AER (CMAQ and REMSAD), and Mike Barna- CIRA (REMSAD)
Methodology • Evaluation used 6-hour tracer data and model predictions for two 10-day periods where tracer data was sequestered: August 15-25, 1999; October 5-15, 1999
CMAQ CMAQ
Northeast Texas tracer and Observed S Northeast Texas tracer August- Particulate S and observed iPPCH Observed S
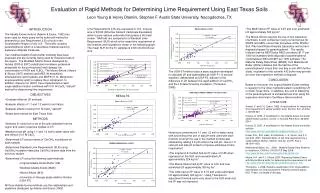
August- CMAQ and observed iPPCH 12km CMAQ and 36km REMSAD NE Texas tracer obs/preds time series for sequestered period Look at CMAQ first… Obs Preds
August- REMSAD and observed iPPCH 12km CMAQ and 36km REMSAD NE Texas tracer obs/preds time series for sequestered period Now REMSAD… Obs Preds
Tracer Release from Big Brown, 22-Aug-1999 00:00 GMT CMAQ-12km REMSAD-36km
Obs CMAQ 36 km
Model performance summary statistics –Northeast Texas tracer, August episode
Model performance summary statistics – Eagle Pass tracer, August episode
Houston tracer and observed S Houston tracer October- Particulate S and observed PTCH Observed S
October- CMAQ and observed PTCH 12km CMAQ and 36km REMSAD Houston tracer obs/preds time series for sequestered period Look at CMAQ first… Obs Preds
12km CMAQ and 36km REMSAD Houston tracer obs/preds time series for sequestered period October- REMSAD and observed PTCH Now REMSAD… Obs Preds
CMAQ 12 and 4 km simulation PTCH (Houston Tracer) October 12 6-hour average starting 19 GMT 22 GMT
REMSAD PTCH REMSAD vs. CMAQ 36 km vs. 12 km PTCH (Houston Tracer) October 12 36 km 12 km
Obs CMAQ 36 km
AER summary of CMAQ tracer transport • In the 36 km simulations, tracer plumes still miss monitoring sites at and near Big Bend on some days • In both the 36 and 4 km simulations for August, the PPCH plumes are too far East • In both the 36 and 4 km simulations for October, the PTCH plumes are too far South • 36 km simulations bring plume a lot closer to Big Bend than 4 km simulations
Model performance summary statistics –northeast Texas tracer, August episode
Model performance summary statistics – Eagle Pass tracer, October episode