Download
1 / 1
10 likes | 137 Views
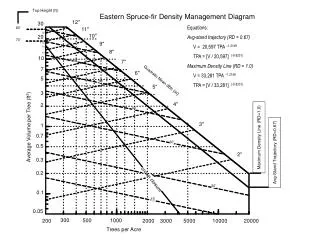
This diagram presents key equations and metrics for managing density in Eastern Spruce-Fir ecosystems. It outlines the average stand trajectory with a relative density (RD.) of 0.67, indicating typical tree volume per acre (TPA) and the maximum density line with an RD of 1.0. Insights into quadratic mean diameter at breast height and average volume per tree provide critical data for effective forest management practices. Understanding these dynamics aids in sustainable yield and ecological balance in forested areas.

E N D
Top Height (ft) Eastern Spruce-fir Density Management Diagram 12" 30 Equations: Avg-stand trajectory (RD = 0.67) V = 20,597 TPA –1.2149 TPA = [V / 20,597] (-0.8231) Maximum Density Line (RD = 1.0) V = 33,281 TPA –1.2149 TPA = [V / 33,281] (-0.8231) 80' 11" 25 10" 20 70' 9" 17.5 15 8" 12 10 60' 7" 7 6" 5 Quadratic Mean dbh (in) 50' 5" 3 4" 2 40' 3" 1 Average Volume per Tree (ft3) Maximum Density Line (RD=1.0) 0.7 30' 0.5 Avg-Stand Trajectory (RD=0.67) 2" 0.3 0.2 crown closure 20' 0.1 15' 0.05 300 500 1000 200 2000 3000 5000 20000 10000 Trees per Acre