Download

1 / 21
210 likes | 294 Views
Learn how to measure your financial health through balance sheets, income statements, and ratio analysis. Discover the importance of budgeting and planning, track your assets and liabilities, analyze income sources and expenses, and use ratios to assess your financial standing.

E N D
Measuring Your Financial Health FIN 1050
What We Will Cover • Balance Sheet • Income Statement • Ratio Analysis
Nothing Happens Without a Plan • If you are like most people, you can probably spend money without thinking about it • However, you can’t save money without thinking about it • Planning and budgeting require self-control • The rewards are worth the sacrifices
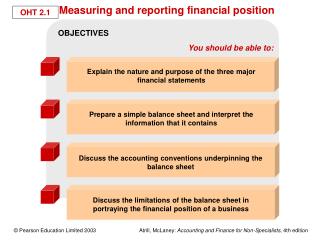
Using a Balance Sheet to Measure Your Wealth • Before you can measure how much you need to save to reach a goal, you have to know • what you own (assets) • what you owe (your debts or liabilities) • The difference between assets and liabilities is net worth
Assets • Monetary assets: • Cash • Checking and savings accounts • Money market funds • Investments: • Stocks, bonds, mutual funds • Retirement Plans • IRAs, 401(k), Keogh plans, etc.
Assets, continued • Housing • If you own a house, it will probably hold the majority of your savings • Vehicles • Car, truck, motorcycle, etc. • Personal property • All of your possessions: furniture, appliances, jewelry, clothes, etc. • Other: anything else of value
Liabilities (Debts) • Current liabilities (those that must be paid off within one year): • Unpaid bills • Credit card debt • Long-Term Liabilities (debts to be paid off in longer than one year) • Mortgage • Car loans • Student loans
Net Worth (Wealth) • The difference between the total of assets and the total of liabilities • If liabilities are greater than assets, you are insolvent • The balance sheet shows your financial standing at a moment in time • It will change from month to month and year to year • If your net worth is going up over time, you are gaining wealth
Check out the balance sheet for Larry and Louise Tate on page 35-36. After reviewing expenses and spending patterns, you can set specific goals to cut back on spending and increase savings. This is a budget.
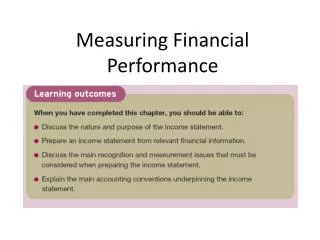
Income Statement • An income statement tells where your money has come from and where it has gone over a period of time • An income statement tells you whether you are earning more than you are spending
Income Statement, continued • See Figure 2.4 on page 38 for a simplified income statement • The formula for determining net income is: Total income – total expenses
Income • Income can include: • Wages • Bonuses • Tips • Commissions • Allowance • Gifts • Taxes must be subtracted from income
Expenses • Expenses are more difficult to track than income is • Sometimes you spend money without leaving a paper trail such as a credit card bill • Expenses can be divided into two categories: • Fixed expenses • Variable expenses
Fixed Expenses • Fixed expenses are expenses that you don’t have a lot of control over and that are the same every month: • Mortgage or rent • Car payment • Insurance premiums • Other loan payments
Variable Expenses • These are expenses that you have some control over: • Food • Clothing • Entertainment • Utilities • Medical expenses • Transportation
See Figure 2.5 on page 39: How American’s Spent Their Money in 2005 Taxes: 32% Housing: 17% Food: 8% Medical Care: 11.5%
See the Income Statement for Larry and Louise Tate on page 40-41.
Using Ratios: A Financial Thermometer • Ratios allow you to analyze raw data and compare them to a preset target or your own previous performance • Ratios answer these questions: • Do I have adequate liquidity to meet emergencies? • Do I have the ability to meet my debt obligations? • Am I saving as much as I think I am?
Monetary Assets Current Ratio= Current Liabilities Current Ratio • Do you have enough cash on hand to meet current obligations? (look for a number > 2) 3590 Current Ratio= = 2.39 1500
Debt Ratio • Do I have the ability to meet my debt obligations? (This should go down over time) Total Debt Debt Ratio = Total Assets 175,500 Debt Ratio = = .5846 or 58% 300,190 Just over half of the Tate’s assets are financed with borrowing
Savings Ratio • How much of your income are you really saving? Income available for savings Savings ratio= Income available for living expenses 4276 Savings ratio = = 7.6% 56,510