Download
1 / 34
340 likes | 622 Views
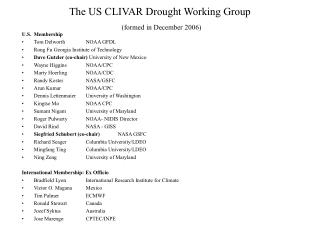
The USCLIVAR Working Group on Drought: A Multi-Model Assessment of the Impact of SST Anomalies on Regional Drought. The US CLIVAR Drought Working Group http://www.usclivar.org/Organization/drought-wg.html. U.S. Membership Tom Delworth NOAA GFDL

E N D
The USCLIVAR Working Group on Drought: A Multi-Model Assessment of the Impact of SST Anomalies on Regional Drought
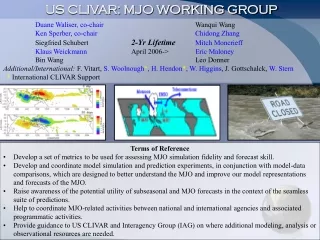
The US CLIVAR Drought Working Grouphttp://www.usclivar.org/Organization/drought-wg.html U.S. Membership • Tom Delworth NOAA GFDL • Rong Fu Georgia Institute of Technology • Dave Gutzler (co-chair) University of New Mexico • Wayne Higgins NOAA/CPC • Marty Hoerling NOAA/CDC • Randy Koster NASA/GSFC • Arun Kumar NOAA/CPC • Dennis Lettenmaier University of Washington • Kingtse Mo NOAA CPC • Sumant Nigam University of Maryland • Roger Pulwarty NOAA- NIDIS Director • David Rind NASA - GISS • Siegfried Schubert (co-chair) NASA GSFC • Richard Seager Columbia University/LDEO • Mingfang Ting Columbia University/LDEO • Ning Zeng University of Maryland International Membership: Ex Officio • Bradfield Lyon International Research Institute for Climate • Victor O. Magana Mexico • Tim Palmer ECMWF • Ronald Stewart Canada • Jozef Syktus Australia
Other interested participants • Lisa Goddard <goddard@iri.columbia.edu> • Alex Hall <alexhall@atmos.ucla.edu> • Jerry Meehl <meehl@ucar.edu> • Jin Huang <Jin.Huang@noaa.gov> • John Marshall <jmarsh@MIT.EDU> • Adam Sobel <ahs129@columbia.edu> • Max Suarez <Max.J.Suarez@nasa.gov> • Phil Pegion <pegion@gmao.gsfc.nasa.gov> • Tim Palmer <Tim.Palmer@ecmwf.int> • Entin, Jared K. <jared.k.entin@nasa.gov> • Donald Anderson <donald.anderson-1@nasa.gov> • Rong Fu <rf66@mail.gatech.edu> • Doug Lecomte <Douglas.Lecomte@noaa.gov> • Hailan Wang <hwang@climate.gsfc.nasa.gov> • Junye Chen <jchen@gmao.gsfc.nasa.gov> • Eric Wood <efwood@princeton.edu> • Aiguo Dai <adai@ucar.edu> • Alfredo Ruiz-Barradas <alfredo@atmos.umd.edu> • Jae Kyung E Schemm <Jae.Schemm@noaa.gov> • Clara Deser cdeser@cgd.ucar.edu • Kirsten Findell <Kirsten.Findell@noaa.gov> • Mark Helfand Mark.Helfand@nasa.gov • Scott J. Weaver <sweaver@gmao.gsfc.nasa.gov> • Kit K. Szeto <Kit.Szeto@ec.gc.ca> • Chunzai Wang <Chunzai.Wang@noaa.gov> • Adam Phillips <asphilli@cgd.ucar.edu> • Matias Mendez <matias@atmosfera.unam.mx> • Hugo Berbery <berbery@atmos.umd.edu>
Terms of Reference • propose a working definition of drought and related model predictands of drought • coordinate evaluations of existing relevant model simulations • suggest new model experiments designed to address some of the outstanding uncertainties concerning the roles of the ocean and land in long term drought • coordinate and encourage the analysis of observational data sets to reveal antecedent linkages of multi-year drought • organize a community workshop in 2008 to present and discuss results
Model Experiments • Force global models with idealized SST anomalies • Address physical mechanisms, model dependence • Participating groups/models: NASA (NSIPP1), Lamont(CCM3), NCEP(GFS), GFDL (AM2.1), NCAR (CAM3.5), and COLA/Univ. of Miami/ (CCSM3.0) • Web site with access to monthly data ftp://gmaoftp.gsfc.nasa.gov/pub/data/clivar_drought_wg/README/www/index.html
Focus Here on Two Leading Patterns of Annual SST Variability Pacific Pattern Atlantic Pattern C
Main Experiments - REOF patterns superimposed on mean seasonal cycle with +/- 2 std amplitude - e.g., PwAc is the combined pattern of warm Pacific and cold Atlantic - all runs 50 years (35 for GFS)
Global Spatial Correlations of Annual Mean Responses Precipitation Agreement among models for response to Pacific is high Agreement is higher for z200 than it is for precipitation Agreement among models for response to Atlantic is lower z 200mb
Warm Pacific Annual Mean Precip (mm/day) and z200 (5 meter CI) Response
Warm Atlantic Annual Mean Precip (mm/day) and z200 (5 meter CI) Response
Annual Precipitation (mm/day) Pacific Cold+Atlantic Warm Pacific Warm+Atlantic Cold US Drought! US Pluvials!
Some Basic Results: Over US • Mean Responses • Models tend to agree that • Cold Pacific+Warm Atlantic => drought/warm • Warm Pacific+Cold Atlantic => pluvial conditions/cold • There are substantial differences in details of anomaly patterns • There is a large seasonality in responses • Potential Predictability (Pacific signal to noise) • Largest in spring • Models appear to agree more on precipitation than surface temperature responses!
Special issue highlighting results is now being put together for J. Climate
Annual Mean Precipitation and 200mb Eddy Height Climatologies The model results are from AMIP-style runs from each model (runs forced by observed SSTs for the period 1980-1998). Contour interval for the height field is 20m (negative values are dashed and the zero line is the first solid contour). Precipitation is in mm/day.
Annual Mean Tsfc Response (°C) Pacific Warm Pacific Cold
Annual Mean Tsfc Response (°C) Atlantic Warm Atlantic Cold
Great Plains (Annual Mean Response) warm Pacific cold Pacific Precip Tsfc
Cold Pacific Annual Mean Precip (mm/day) and z200 (5 meter CI) Response
Cold Atlantic Annual Mean Precip (mm/day) and z200 (5 meter CI) Response
Annual Precipitation (mm/day) Pacific Cold Atlantic Warm Tendency for US Drought!
Annual Precipitation (mm/day) Pacific Warm Atlantic Cold Tendency for US Pluvials!
Annual Precipitation (mm/day) Pacific Cold+Atlantic Warm Pacific Warm+Atlantic Cold US Drought! US Pluvials!
DJF - Cold Contours: 200mb height anomalies Vectors: 850mb wind anomalies Colors: precipitation anomalies Weak and shifted anti-cyclonic anomalies
MAM - Cold General consistency in height anomalies but CFS again shifted south
JJA - Cold Cyclonic anomalies in IAS
SON - Cold Cyclonic anomalies in IAS
Great Plains (Seasonality of Response) warm Pacific cold Pacific DJF MAM Precip Tsfc JJA SON
Predictability Measures Signal to Noise Ratio
Signal to Noise Ratio ( R) R = ( x-y )/sxy ( ): 50 yr mean x: seasonal mean from experiment y: seasonal mean from control (climatological SST) s2xy= (s2X+s2Y)/2 s2X variance of seasonal mean from experiment s2Y : variance of seasonal mean from control
Focus U.S. Response to Pacific Forcing NW SW SE GP
Precipitation Response to Warm and Cold Pacific (signal/noise) R R