Download
1 / 1
10 likes | 307 Views
Relationship between the diagnostic and heavy rainfall events The diagnostic was found to provide a good indication of heavy rainfall events, with the proportion of events identified increasing for increasing amounts of rainfall (Fig. 3). Applicability to GCMs

E N D
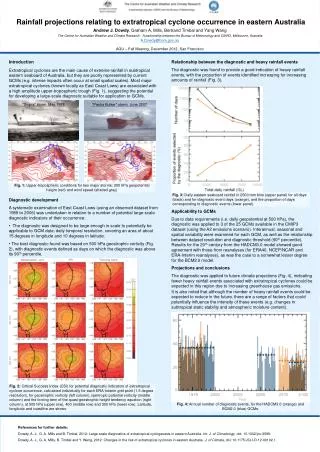
Relationship between the diagnostic and heavy rainfall events The diagnostic was found to provide a good indication of heavy rainfall events, with the proportion of events identified increasing for increasing amounts of rainfall (Fig. 3). Applicability to GCMs Due to data requirements (i.e. daily geopotential at 500 hPa), the diagnostic was applied to 3 of the 25 GCMs available in the CMIP3 dataset (using the A2 emissions scenario). Interannual, seasonal and spatial variability were examined for each GCM, as well as the relationship between dataset resolution and diagnostic threshold (90th percentile). Results for the 20th century from the HADCM3.0 model showed good agreement with those from reanalyses (for ERA40, NCEP/NCAR and ERA-Interim reanalyses), as was the case to a somewhat lesser degree for the BCM2.0 model. Projections and conclusions The diagnostic was applied to future climate projections (Fig. 4), indicating fewer heavy rainfall events associated with extratropical cyclones could be expected in this region due to increasing greenhouse gas emissions. It is also noted that although the number of heavy rainfall events could be expected to reduce in the future, there are a range of factors that could potentially influence the intensity of these events (e.g. changes in subtropical static stability and atmospheric moisture content). • Introduction • Extratropical cyclones are the main cause of extreme rainfall in subtropical eastern seaboard of Australia, but they are poorly represented by current GCMs (e.g. intense impacts often occur at small spatial scales). Most major extratropical cyclones (known locally as East Coast Lows) are associated with a high amplitude upper-tropospheric trough (Fig. 1), suggesting the potential for developing a large-scale diagnostic suitable for application to GCMs. • Diagnostic development • A systematic examination of East Coast Lows (using an observed dataset from 1989 to 2006) was undertaken in relation to a number of potential large-scale diagnostic indicators of their occurrence: • The diagnostic was designed to be large enough in scale to potentially be applicable to GCM data: daily temporal resolution, covering an area of about 15 degrees in longitude and 10 degrees in latitude. • The best diagnostic found was based on 500 hPa geostrophic vorticity (Fig. 2), with diagnostic events defined as days on which the diagnostic was above its 90th percentile. “Sygna” storm, May 1974 “Pasha Bulker” storm, June 2007 Rainfall projections relating to extratropical cyclone occurrence in eastern Australia Fig. 1: Upper-tropospheric conditions for two major storms: 300 hPa geopotential height (red) and wind speed (shaded grey) Fig. 3: Daily eastern seaboard rainfall in 2500 mm bins (upper panel) for all days (black) and for diagnostic event days (orange), and the proportion of days corresponding to diagnostic events (lower panel). Andrew J. Dowdy, Graham A. Mills, Bertrand Timbal and Yang Wang The Centre for Australian Weather and Climate Research - A partnership between the Bureau of Meteorology and CSIRO, Melbourne, Australia A.Dowdy@bom.gov.au AGU – Fall Meeting, December 2012, San Francisco Fig. 2: Critical Success Index (CSI) for potential diagnostic indicators of extratropical cyclone occurrence, calculated individually for each ERA-Interim grid point (1.5 degree resolution), for geostrophic vorticity (left column), isentropic potential vorticity (middle column) and the forcing term of the quasi-geostrophic height tendency equation (right column), at 500 hPa (upper row), 400 (middle row) and 300 hPa (lower row). Latitude, longitude and coastline are shown. Fig. 4: Annual number of diagnostic events, for the HADCM3.0 (orange) and BCM2.0 (blue) GCMs. References for further details: Dowdy, A. J., G. A. Mills and B. Timbal, 2012: Large-scale diagnostics of extratropicalcyclogenesis in eastern Australia. Int. J. of Climatology, doi: 10.1002/joc.3599. Dowdy, A. J., G. A. Mills, B. Timbal and Y. Wang, 2012: Changes in the risk of extratropical cyclones in eastern Australia. J. of Climate, doi: 10.1175/JCLI-D-12-00192.1.