Download
1 / 28
290 likes | 310 Views
This study aims to improve the validation and prediction of rainfall associated with tropical cyclones. It examines various factors impacting rainfall distributions, evaluates different forecasting models, and assesses their sensitivity to track errors. The study also explores the impact of shear on accumulated rainfall and proposes new forecasting tools for tropical cyclone rainfall.

E N D
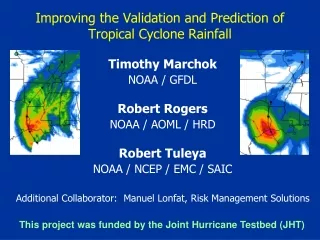
Improving the Validation and Prediction of Tropical Cyclone Rainfall Robert Rogers NOAA/AOML/HRD Tim Marchok NOAA/GFDL Bob Tuleya NCEP/EMC/SAIC Funded by NOAA Joint Hurricane Testbed
Rainfall forecasts from landfalling TC’s standard forecasting tools • Kraft rule of thumb • numerical model guidance • R-CLIPER standard validation tools • bias score • equitable threat score • pattern correlation
Factors impacting rainfall distributions in landfalling TC’s • storm track • topography • interaction with synoptic-scale features • storm intensity • land-surface boundary
U.S. Landfalling Cases for Model Evaluation 1998 1998 1999 1999 2000 2000 2001 2001 2002 2002 2003 2003 2004 2004 Bonnie Bonnie Bret Bret Gordon 55 Gordon 55 Allison Allison Bertha Bertha Bill Bill Bonnie Bonnie 45 45 95 95 100 100 45 45 35 35 50 50 Charley 40 Charley 40 Dennis Dennis Helene Helene Barry Barry Edouard Edouard Claudette Claudette Charley Charley 125 125 60 60 65 65 60 60 35 35 75 75 Earl Earl Floyd Floyd Gabrielle 60 Gabrielle 60 Fay Fay Grace Grace Frances Frances 95 95 70 70 90 90 50 50 35 35 Frances Frances Harvey Harvey Hanna Hanna Henri Henri Gaston Gaston 65 65 45 45 50 50 45 45 30 30 Georges Georges Irene Irene Isidore Isidore Isabel Isabel Ivan Ivan 110 110 90 90 70 70 55 55 90 90 Hermine Hermine Kyle Kyle Jeanne Jeanne 105 105 35 35 35 35 Lili Lili Matthew Matthew 40 40 85 85
Models included in this study NCEP/GFS Global T254 (~0.6o) 64 levels Rainfall- CLIPER NCEP/Eta Regional 12 km 60 levels Climatology-based parametric model GFDL Regional 1/2o, 1/6o (2-nest) 42 levels 2003 version
Isabel 24-hr rain from 12 UTC 18 to 12 UTC 19 September 2003 (12 UTC 17 forecasts) R-CLIPER GFDL GFS Eta Stage IV
Parameters describing skill of TC QPF forecasts • Pattern • Volume • Extreme amounts • Sensitivity to track errors
Pattern comparisons for U.S. landfalling storms Equitable Threat Score
Distributions of rain flux in bands surrounding storm track Observed PDF for all storms in selected bands Coastline = 0-100 km from track = 100-200 km from track = 200-300 km from track = 300-400 km from track
Distributions of model rain flux in bands surrounding forecasted storm track 0-100 km 300-400 km
Top 5% of rain flux comparisons % of flux > observed 95th percentile threshold GFDL: 8% Eta: 2.3% R-CLIPER: 3% GFS: 5%
Example of grid-shifting of rain field Eta shifted Eta unshifted Lili Stage IV r increased from 0.36 (unshifted) to 0.85 (shifted)
Summary comparison for all models Pattern • GFS performs best • all models show skill relative to R-CLIPER • GFDL worst among numerical models Volume • All models essentially equivalent • GFS slightly better • all show skill over R-CLIPER
Summary comparison for all models (cont.) Extremes • GFS best • GFDL produces too much of heaviest rain • both show skill over R-CLIPER • Eta shows no skill over R-CLIPER Sensitivity to track error • GFS least sensitive to track error • GFDL, Eta more sensitive to track error than R-CLIPER
Future work • finish development of a set of metrics that synthesizes various aspects of TC QPF • determine way of picking out other contributors to rainfall variability other than track (e.g., topography) in validation scheme • develop parametric rainfall model that accounts for vertical shear; validate this model using same metrics • add other sources of variability to new parametric model (e.g., topography, synoptic environment)
Example of footprint: Hurricane Ivan a) Wavenumber 0 b) Wavenumber 1,2 mm h-1 mm h-1 06 UTC 09/23/2004 The Footprint is “stamped” on a lon/lat grid every 15 minutes, providing a storm total accumulation
Impact of shear on accumulated rain Only Wave numbers 1,2 included (inches)
Impact of shear on total accumulated rain Ivan – R-CLIPER control run Ivan – R-CLIPER run including shear (inches) (inches)
QPF Equitable Threat Score Where H = “Hit” area F = Forecast rain area O = Observed rain area H -chance ETS = F + O – H -chance No overlap: Hit area = 0 Fcst Obs ETS ~ 0 Hit Area Hit area = ½ Forecast area ETS ~ 0.33 Hit area = Forecast area ETS = 1.0