Download
1 / 25
250 likes | 389 Views
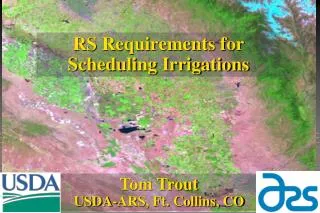
RS Requirements for Scheduling Irrigations. Tom Trout USDA-ARS, Ft. Collins, CO. Irrigated Ag 75% of water consumption 18% of cropped land 40%+ Crop Value. San Joaquin Valley. Irrigation Scheduling Approaches. Soil Water Deficit Plant Indicators Estimated Water Use (ET). 800m. 160 ac.

E N D
RS Requirements for Scheduling Irrigations Tom TroutUSDA-ARS, Ft. Collins, CO
Irrigated Ag • 75% of water consumption • 18% of cropped land • 40%+ Crop Value San Joaquin Valley
Irrigation Scheduling Approaches Soil Water Deficit Plant Indicators Estimated Water Use (ET)
800m 160 ac 130 ac Spatial Resolution 400m 40 ac 80 ac 200m 10 20 100m 5
Temporal Resolution / Frequency Require Cumulative ETc • Continuous measurement or frequent enough to interpolate with sufficient accurately between measurements.
Requirements for Irrigation Scheduling Spatial Resolution • Acceptable – 50m • Preferred – 10m Temporal Resolution • Continuous • Weekly if good interpolation Near Real Time Easy to access and interpret Inexpensive
ApproachesEnergy Balance – Thermal BandTraditional (FAO-56)with Vegetation Indices (Red/NIR)
ETr Weather Stations/Networks CIMIS – California CoAgMet – Colorado AZMET – Arizona AgriMet – NorthWest AgWeatherNet – Washington MesoNet – Oklahoma AWDN – Nebraska, Dakotas + Weather Data Library – Kansas TXHPET – Texas High Plains
Kc is related to Light Interception(Ground Cover) Develop Relationship betweenGround Cover and Kcbfor Crops
Development of Reflectance-Based Crop Coefficients for Corn Transactions of the ASABE. 32(6) 1891-1900. @1990 Christopher M. U. Neale, Walter C. Bausch, Dale F. Heermann ABSTRACT Concurrent measurements of reflected canopy radiation and the basal crop coefficient (Kcb) for corn were conducted throughout a season in order to develop a reflectance-based crop coefficient model. Reflectance was measured in Landsat Thematic Mapper bands TM3 (0.63 - 0.69 um) and TM4 (0.76 - 0.90 um) and used in the calculation of a vegetation index called the normalized difference vegetation index (NDVI).
Kcb=1.13*fc + 0.14 R2 = 0.99
Kcb min = 0.15 Kcb full = Fr(min(1+0.1h,1.2))+[0.04(u-2)-.004(RH-45]*(h/3)0.3)
NDVI <0.1 0.1-0.2 0.2-0.3 0.3-0.4 >0.4 NDVI Apr 4 Jun 7 Aug 26 Oct 13
fc (%) <10 10-30 30-50 50-70 >70 fc fc=1.26*NDVI - 0.18 Apr 4 Jun 7 Aug 26 Oct 13
<0.2 0.2-0.4 0.4-0.6 0.6-0.8 >0.8 Kcb Kcb=1.13*fc + 0.14 Apr 4 Jun 7 Kcb Aug 26 Oct 13
ET (mm) <2 2-3 3-4 4-5 >5 ETcb ETcb=Kcb*ETo Apr 4 Jun 7 Aug 26 Oct 13
Comparing years June 2000
NDVI – fc – Kcb – ETcbApproach • Relatively simple, easy to implement, automate • Many RS image options, many resolutions • Fairly easy to interpolate/extrapolate – plant growth • Requires ground-based ETr • Indirect estimate of ETcb • Doesn’t include evaporation • Can’t estimate ETc of stressed crops