
PRESENTED BY
gates
1 SLIDES
176 VIEWS
10 LIKES
(B)
DESCRIPTION
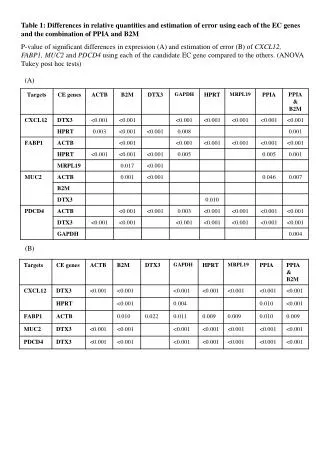
Table 1: Differences in relative quantities and estimation of error using each of the EC genes and the combination of PPIA and B2M
Download
1 / 1
Download Presentation 
(B)
An Image/Link below is provided (as is) to download presentation
Download Policy: Content on the Website is provided to you AS IS for your information and personal use and may not be sold / licensed / shared on other websites without getting consent from its author.
Content is provided to you AS IS for your information and personal use only.
Download presentation by click this link.
While downloading, if for some reason you are not able to download a presentation, the publisher may have deleted the file from their server.
During download, if you can't get a presentation, the file might be deleted by the publisher.
E N D
Presentation Transcript
Table 1: Differences in relative quantities and estimation of error using each of the EC genes and the combination of PPIA and B2M P-value of significant differences in expression (A) and estimation of error (B) of CXCL12, FABP1, MUC2 and PDCD4 using each of the candidate EC gene compared to the others. (ANOVA Tukey post hoc tests) (A) (B)


More Related