Download
1 / 5
50 likes | 114 Views
Figure 1: Live/Dead assay shows high mortality in cells treated with ImageJ software. Figure 2: RT-PCR visual analysis indicates stem cell differentiation but no chondrogenesis. Figure 3: RT-PCR analysis determines collagen II and collagen I transcript levels. Figure 4: Collagen I and II proteins calculated from standard concentration curves. Figure 5: ELISA analysis reveals collagen I and II protein levels in samples.

E N D
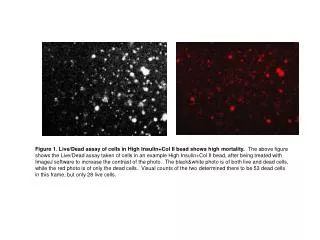
Figure 1. Live/Dead assay of cells in High Insulin+Col II bead shows high mortality. The above figure shows the Live/Dead assay taken of cells in an example High Insulin+Col II bead, after being treated with ImageJ software to increase the contrast of the photo. The black&white photo is of both live and dead cells, while the red photo is of only the dead cells. Visual counts of the two determined there to be 53 dead cells in this frame, but only 28 live cells.
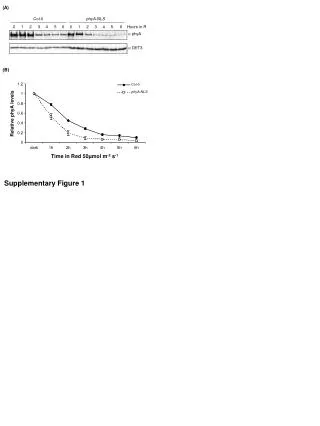
1Kb Ladder control Col I Low Insulin Col II High Insulin Col II High Insulin + Col II Col I control Col II High Insulin + Col II Col II High Insulin Col I Low Insulin Col I 1Kb Ladder Figure 2.Visual analysis of RT-PCR shows significant differentiation of stem cells, but not chondrogenesis. After performing the RT-PCR that amplified either collagen I or collagen II cDNA, we ran the samples on a 1.2% agarose gel. Visual comparison of band intensities showed a significant decrease in collagen I production in all samples when compared to the control, indicating stem cell differentiation. However, none of the samples indicated the presence of collagen II, implying no chondrocytes present. In all the samples was found an unknown band of cDNA. There is an increase in production in all samples compared with the control, with the High Insulin+Col II sample having the least.
A) B) C) Figure 3.Analysis via RT-PCR to determine collagen II and collagen I transcript levels. 100 ng of RNA from each sample was used for RT-PCR , and the resulting cDNA samples were run on a 1.2% agarose gel to visualize the collagen transcript. A gel image was taken at .72 s and analyzed with ImageJ to determine the relative brightness of the bands, corresponding to transcript level. we calculated the collagen I/GAPDH ratio, collagen II/GAPDH ratio, and collagen II/collagen I ratio: A) For the collagen I /GAPDH, we obtained ratios of 3.02 for the normal sample, 0.80 for the 15 µg/mL insulin sample, 0.58 for the 50 µg/mL insulin sample, and 1.0 for the collagen + alginate bead sample. B) For the collagen II/GAPDH, we obtained respective ratios of 0.01, 0.15, 0.11, and 0.11. C) For the collagen II/collagen I, we obtained respective ratios of 0.003, 0.19, 0.19, and 0.11.
Standard Curves Figure 4. Collagen I and II proteins were calculated from Standard Concentration Curves. In order to calculate protein concentrations from our ELISA, standards ranging from 10 ug/mL to 78 ng/mL of collagen by 2-fold dilution were employed. After subtracting background from the absorbance values obtained, we plotted and fit the data to a linear regression. We omitted the data points corresponding to 10 ug/mL and 5 ug/mL because they did not fit the linear scheme of the concentration curve. Shown above are the linear fits for the standard concentration data, with error bars indicating a 95% confidence interval. The top two figures were utilized for the insulin samples, while the bottom two were utilized for the normal growth medium and collagen bead samples.
Figure 5 ELISA Analysis to determine collagen I and collagen II protein levels in our samples 50 µL of each of our 4 samples were assayed in replicates for collagen I and collagen II protein levels. We created standard curves (shown in the previous images) and found the concentrations of collagen II and collagen I in each of our samples. Shown in this image are the ratios of collagen II to collagen I concentrations for each of our samples. The high ratios in the low insulin and high insulin sampes suggest that more chondrogenesis occurred in both of these sample compared to the control sample. The low ratio in the collagen II and high insulin sample suggests that collagen II inhibited chondrogenesis.