Download
1 / 1
20 likes | 157 Views
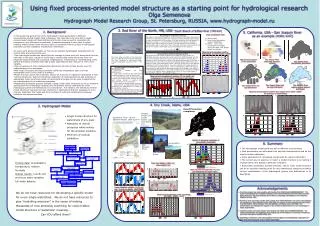
Using fixed process-oriented model structure as a starting point for hydrological research Olga Semenova Hydrograph Model Research Group, St. Petersburg, RUSSIA, www.hydrograph-model.ru. 3. Red River of the North, MN, USA - South Branch of Buffalo River (749 km 2 ). 1. Background.

E N D
Using fixed process-oriented model structure as a starting point for hydrological research Olga Semenova Hydrograph Model Research Group, St. Petersburg, RUSSIA, www.hydrograph-model.ru 3. Red River of the North, MN, USA - South Branch of Buffalo River (749 km2) 1. Background 5. California, USA – San Joaquin River as an example (4341 km2) Used precipitation data • In this poster the general line of the Hydrograph model applications in different environments started at EGU 2009 is followed. The main idea is to show that a single process-based model with fixed distributed structure may be used to investigate the processes in very different environments. It seems reasonable in each case to adjust existing, widely tested model structure which is consistent with the scales of hydrological processes and the availability of parameter information. • As usual, some general thoughts on how we can advance hydrological modelling from its current state are presented as well: • The hydrological community should find the courage to leave some old, discredited theories and ideas in the past; instead of continuing to constructing model structures from non-physically-based blocks and conceptual simplifications; maintaining an understanding of the general processes combined with high-quality observational data may give a rise to new insights. • The convenience of some mathematical approaches should not take priority over the understanding of the processes. • New model structures should be carefully verified by independent data on similar watersheds (even if only runoff is available). • Model structure, where this is flexible, should not fully rely on calibration techniques to find “optimal structures”. Rational intellectual calibration of model parameters and decisions on appropriate model structures based on hydrological principles can be used if supported by an understanding of the underlying processes. • Reasonably developed, process-oriented, robust, fixed model structures can be an excellent starting point for hydrological research and will provoke serious consideration of the hydrological system and deficiencies in its description. For instance, the limitations of fixed model structures may point out new directions in observations that are necessary to more properly implement the model and form the basis of enhanced collaborations between modellers and experimentalists. Accounting for Depression Storage The depth of depression storage is the part of surface runoff depth expended for filling micro-relief depressions of the watershed surface. Potential opportunities to retain a definite part of the surface runoff are caused by the free capacity of depression storage, i. e. by the difference between the maximum possible capacity (DM) and the amount of water in the depressions at the moment of commencing surface runoff (HP). Then, the depth of surface runoff retention (D) with known surface runoff depth (Hq) can be defined by the equation • Station data • Snow Data Assimilation System (SNODAS) • MAPX – mean areal precipitation calculated using the radar- and gauge-based information. Observed and simulated runoff by Hydrograph and Sacramento models Accounting for artificial drainage system The winter soil frost creates conditions for surface flow when frozen soil infiltration rates are very low and prevent water from infiltrating deep into the soil. In those cases, surface flow occurs and goes directly to the agricultural drainage systems loosing some water to the depression storages on the way. In such a way, this type of flow can not be considered typical surface flow in the sense it is used in the Hydrograph model. This type of flow has a more deferred contribution into the river network. Given the available information about the river network and drainage system, which is more generic rather than specific, accounting for those processes was made possible by a change in the surface runoff elements parameters. In this way, the values of the conditional constants a* (see [1] for details), were changed from 1000 to 10 for a surface type of flow and from 100 to 5 – for soil type of flow. The study area is located at the south-east part of the Red River of the North watershed. The main landscape is agricultural fields. Annual precipitation amounts to 600 – 750 mm. San Joaquin River watershed elevation scheme Map showing location of the watersheds San Joaquin River precipitation distribution • The hydrology of the study area is characterized by: • snowcover modified by wind redistribution; • high surface runoff from the major spring snowmelt event as a result of frozen soils; • most rainfall occurring in spring and early summer from large frontal systems and the most intense rainfall in summer from convective storms over small areas; • poorly-drained natural stream networks; • large amount of artificial agricultural tiles influencing the redistribution of runoff into the streamflow network; • small post-glacial depressions which may not drain to any natural external drainage system and have large storage capacity. Observed and simulated soil moisture (50 cm depth) and temperature at (10 cm depth) at Crescent Lake station San Joaquin River land use type distribution San Joaquin River meteorological stations distribution San Joaquin River soil type distribution Observed and simulated runoff for San Joaquin River (2005 – 2008) No calibration is implemented 4. Dry Creek, Idaho, USA 2. Hydrograph Model Runoff formation complexes R Grasses, shrubs, and conifer forests vary with aspect and elevation • Single model structure for watersheds of any scale • Adequacy to natural processes while looking for the simplest solutions • Minimum of manual calibration Catchment Area: 28 km2 Elevation Range: 1030-2130 m Results of sequential calibration of groundwater parameters 6. Summary Low Elevation Grass High Elevation Forest • The Hydrograph model performs well in different environments • Most parameters are estimated from physical characteristics and do not require further calibration • Some parameters of conceptual components do require calibration • The correct way to approve or reject a model structure is by testing it multiple times over basins in different conditions • Reasonably developed, process-oriented, robust, fixed model structure can be an excellent starting point for any hydrological research provoking serious consideration of the hydrological system and deficiencies in its description Mid Elevation Shrub Forcing data: precipitation, temperature, relative humidity Output results: runoff, soil and snow state variables, full water balance Tree Line station (1651 m), snow depth (m) Observed and simulated flow for even and distributed soil depth cases 2002-2003 2008-2009 Lower Weather station (1151 m), soil, 5 and cm depth, 2007-2008 Acknowledgements We do not have resources for developing a specific model for every single watershed… We do not have resources to play “modelling exercises” in the sense of making thousands of runs aimlessly searching for some hidden model structure or parameter meaning…. Can YOU afford them? • Dry Creek project was made possible with funding from NOAA Grant NA08NWS4620047. The author acknowledges the invaluable assistance from James McNamara and Pam Aishlin at Boise State University, and Pedro Restrepo at the Office of Hydrologic Development of the National Weather Service, USA. • Red River study was made possible with contract from NOAA NWS OHD. The author acknowledges the assistance of Pedro Restrepo at the OHD NWS, the support of Mike DeWeese and Steve Buan from the NCRFC, Carrie Ohlheiser from the NOHRSC, and Victor Koren from OHD. The administrative and management support of the contract by Robert Brown of Len Technologies is highly appreciated. • California project was made possible with funding from NOAA Grant NA09NWS4620044. The author acknowledges the assistance from Xiogang Gao at the Regents of University of California, and Pedro Restrepo at the OHD NWS, USA. • Attendance to EGU 2011 was made possible with the support of German-Russian Laboratory for Polar and Marine Research which is highly appreciated. Observed and simulated runoff, LowerGageNS (2000 – 2009) = 0.43