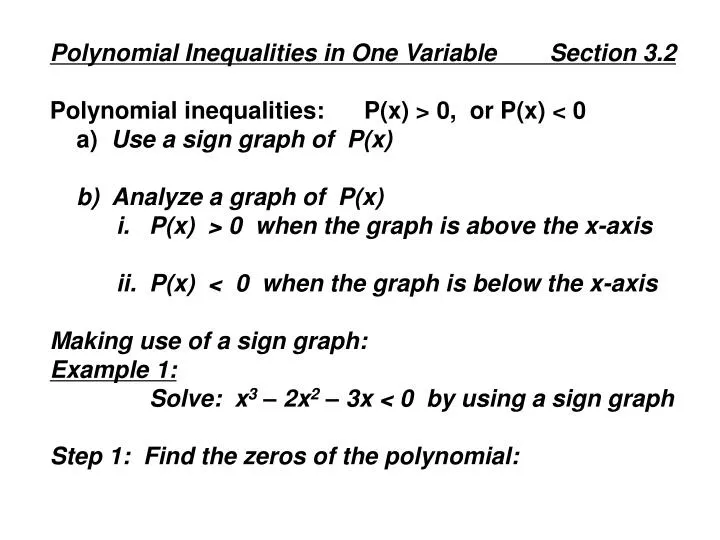

Polynomial Inequalities in One Variable Section 3.2
E N D
Presentation Transcript
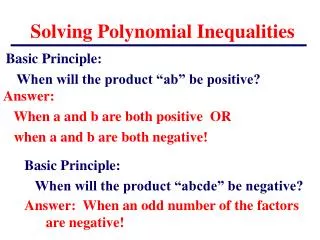
Polynomial Inequalities in One Variable Section 3.2 Polynomial inequalities: P(x) > 0, or P(x) < 0 a) Use a sign graph of P(x) b) Analyze a graph of P(x) i. P(x) > 0 when the graph is above the x-axis ii. P(x) < 0 when the graph is below the x-axis Making use of a sign graph: Example 1: Solve: x3 – 2x2 – 3x < 0 by using a sign graph Step 1: Find the zeros of the polynomial:
P(x) = x3 – 2x2 – 3x • P(x) = x(x2 – 2x – 3) • P(x) = x(x – 3)(x + 1) • Zeros: x = 0, x = 3, x = - 1 • Now plot the zeros on a number line: < > • -1 0 3 • Now these ‘3’ zeros separate this number line into ‘4’ • Areas. • All the values less than -1, • all the values between -1 and 0, • all the values between 0 and 3 and • all the values greater than 3. • Now, pick a number in an area—say ‘1’. Substitute ‘1’ in • For ‘x’ 1(1-3)(1+1) 1(-2)(2) -4
So that means when x = 1, P(x) which is ‘y’ is negative! Now using our rule for ‘roots’ we discovered a chapter Ago, the graph of P(x) will change sign after it goes Through each root, since they are all single roots. --- + ---- +++ < > -1 0 3 Now, use this sign graph and the fact that we are dealing with P(x) < 0 ( which means we want to be negative) By analyzing we see all numbers less than -1 are negative And all numbers in the area between 0 & 3 are negative so our answer should be: x< -1 or 0 < x < 3 or in interval notation (- ∞, -1) U (0,3) Example 2 Solve : (x2 – 1)(x – 4)2> 0
First find the roots: x2 – 1 = 0 and (x – 4)2 = 0 √ x2 =√ 1 √(x – 4) = √0 x = + 1 x – 4 = 0 x = 4 Now plot these 3 roots on a number line and make a ‘sign’ graph ---|-----|----|----|----|----|----|----|- - 1 1 4 Pick a number you could evaluate easily (cannot be a root) like x = 0 go to original equation and plug in 0 for x (02 – 1)(0 – 4)2 (-1)(-4)2 (-1)(16) = - 16 Now since ‘4’ is a double root the graph will not change sign at that spot Soo putting (-) on top of where 0 lies and changing sign at every root except at 4 + + + - - - - + + + + + + + + ---|-----|----|----|----|----|----|----|- - 1 1 4 Since our original inequality has > 0 we need the areas where the + signs are. Answer: x < -1 or x > 4
Example 3: (x +2)(x – 5)2< 0 x - 4 1st: Find and list all possible roots from both numerator & denominator x = - 2, x = 5 (double root) and x = 4 plot those values on a number line since - 2 and 5 are ‘roots’ from the top these are OK and should be solid points (because of the = sign) butt 4 is from the bottom and we can never let the bottom = 0 so when we plot this point is must be ‘open’. |---|---|---|---|---|---|---|---|---|---|---| -2 4 5 Pick a number which is not a ‘zero’ like 1 and plug in to see what kind of value you get from this expression (1+2)(1-5)2 = (3)(-4)2 (1-4) (-3) = (3)(16) - 3 so when x = 1 = - # Sooo using the rules we have described earlier gives us: + + + - - - - - - - - - - - - + + + + + + + |---|---|---|---|---|---|---|---|---|---|---| -2 4 5 Since our inequality is < 0 we want where the negative signs are thus -2 < x < 4 is our solution
Example 4: Use your grapher to aid in solving: 2x3 + x2 – 8x + 3 > 0 I can explain this in class tomorrow. Hw Pg 103 CE #1-6 all; WE #1-19 odd