Download
1 / 20
200 likes | 325 Views
SURVIVING THE RECOVERY The Distribution of Canadian Household Debt. Armine Yalnizyan Senior Economist Canadian Centre for Policy Alternatives Annual CEA Meetings Ottawa June 3, 2011. Household debt s tabilizing…..at r ecord h ighs. Is this a debt wall?. Two Drivers of Debt.

E N D
SURVIVING THE RECOVERY The Distribution of Canadian Household Debt Armine Yalnizyan Senior Economist Canadian Centre for Policy Alternatives Annual CEA Meetings Ottawa June 3, 2011
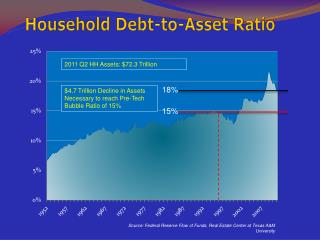
Household debt stabilizing…..at record highs. Is this a debt wall?
How risky is this? • Aggregates don’t tell the full story • Distributional element is key – incidence of the problem, depth of problem, “hot spots” • Debt rising among all income groups according to SFS data, 1999 to 2005
Oh, and here’s another reason why – no real income growth for most til 2007
What’s happened since 2005? • Lack of data on distribution of debt and assets since SFS 2005. (How about that recession?) • CFCS 2009 provides a glimpse, no before and after the recession • Sample size – just over 15,500 • Complaint about constraints on StatCan
How Deep Is the Hole? • Only one in five households with debt (21%) owe MORE THAN $200K • highest incidence in Q 4 and Q5 • age sensitive (highest incidence among under 45s) • Half of households with debt (49%) owe LESS THAN $50K • highest incidence in Q1 to Q3 • less age-sensitive
Distribution of Debt Under $50K, 2009 by age and income quintile
Who’s most exposed to risk? • Lower income: more potential for small things to become financial catastrophes • Big debt: very reliant on job, income security • Elderly lower incidence, but not risk-free • Response to recession – are we deleveraging yet? Household financial flows critical
Caution: Bumpy Road Ahead • Rising prices • Downward pressure on wages, benefits, pensions (for some, not all) • Government cutbacks (fewer good paying jobs) • Slow private sector job creation (and more temporary jobs) • Rising interest rates • Slowth (slow growth) in many places