Download
1 / 30
300 likes | 417 Views
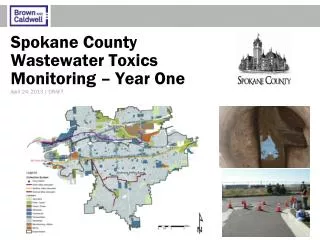
Spokane County Wastewater Toxics Monitoring – Year One. April 24, 2013 | DRAFT. Agenda. NPDES permit requirements Sampling locations & methods Results Next steps (draft) Draft Action submitted to Ecology on 4/15/2013. Spokane Area – Sewer Service.

E N D
Spokane County Wastewater Toxics Monitoring – Year One April 24, 2013 | DRAFT
Agenda • NPDES permit requirements • Sampling locations & methods • Results • Next steps (draft) • Draft Action submitted to Ecology on 4/15/2013 Brown and Caldwell | DRAFT
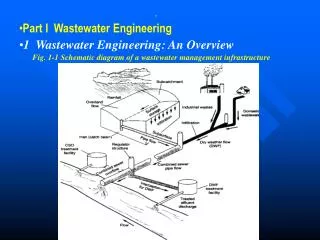
Spokane Area – Sewer Service City of Spokane Riverside Park Water Reclamation Facility ▲ N North Spokane ... serves North Spokane Spokane Valley Spokane County Regional Water Reclamation Facility Downtown Spokane ... serves Spokane Valley Brown and Caldwell | DRAFT
NPDES Permit Special Conditions • S2 requires monitoring of Spokane County Regional Water Reclamation Facility (SCRWRF) influent and effluent Brown and Caldwell | DRAFT
NPDES Special Permit Conditions (cont’d) • S9 requires preparation of a Quality Assurance Project Plan (QAPP) • S12 requires development of a plan with a goal of reducing to the maximum extent practicable PCB loads in the County’s wastewater collection system • Influent sample results are needed to help identify PCB sources Brown and Caldwell | DRAFT
Sampling Locations – Year One North Valley Interceptor Sampling Location EffluentSampling Location Spokane Valley Interceptor Sampling Location Brown and Caldwell | DRAFT
Sampling Location – Spokane Valley Interceptor (SVI) Pump Station Brown and Caldwell | DRAFT
Sampling Location – North Valley Interceptor (NVI) Pump Station Brown and Caldwell | DRAFT
Sampling Location – SCRWRF Effluent Brown and Caldwell | DRAFT
Sampling Procedures Automated Sampler Sampler Calibration Teflon Tubing Composite Sample Bottle Sampler Intake Brown and Caldwell | DRAFT
2,3,7,8-TCDD Results NT = not tested U flags indicate the substance was not detected at the reporting level. K flags indicate a peak was detected but did no meet qualification criteria. The result reported is the estimated maximum possible concentration J flags indicate that the sample concentration was lower than the lowest calibration equivalent Brown and Caldwell | DRAFT
PBDE Results NT: Not tested Brown and Caldwell | DRAFT
PBDE Results Influent Brown and Caldwell | DRAFT
PBDE Homologs – Influent Samples Brown and Caldwell | DRAFT
PCB Results NT: Not tested Brown and Caldwell | DRAFT
PCB Results Influent Brown and Caldwell | DRAFT
PCB Homologs - Influent Samples Brown and Caldwell | DRAFT
PCB Aroclor Results – Influent Samples Brown and Caldwell | DRAFT
Common Uses of Aroclors Brown and Caldwell | DRAFT
Next Steps (Draft) • Work with Ecology to update the QAPP • Begin trackdown sampling in collection system upstream of NVI and SVI pump stations Wastewater in County collection system Brown and Caldwell | DRAFT
Potential Trackdown Strategies (Draft) • “Top-down” strategy - focus on known or suspected sources • “Bottom-up” strategy- systematic downstream to upstream approach Brown and Caldwell | DRAFT
Land Uses by Basin Table 3 - 1. Land Use within the Five Basins D elineated on Figure 3 - 2 Land U se NVI Upper SVI Upper DMI SVI_Lower NVI_Lower Agricultural 3.1% 4.6% 4.4% 0.8% 0.0% Commercial 9.2% 14.7% 6.7% 13.9% 19.7% Forest/timber 1.6% 0.0% 1.6% 0.1% 0.0% Manufacturing 8.5% 0.5% 0.6% 1.2% 1.6% Mining 2.4% 0.6% 0.0% 3.5% 0.0% Parks, v acant 15.1% 5.7% 1.4% 4.2% 5.3% Residential 45.4% 60.0% 75.6% 50.1% 50.7% Right of Way 10.2% 12.9% 9.5% 21.1% 17.0% Transportation 2.4% 0.0% 0.1% 1.7% 4.6% Wholesale 2.0% 0.9% 0.1% 3.4% 1.1% Summary Residential 45.4% 60.0% 75.6% 50.1% 50.7% • Commercial/industrial/ROW 34.7% 29.7% 17.0% 44.9% 44.0% Open spaces 19.8% 10.3% 7.4% 5.0% 5.3% Brown and Caldwell | DRAFT
Proposed Trackdown Approach (Draft) Brown and Caldwell | DRAFT
Proposed Trackdown Locations for 2013 (Draft) Brown and Caldwell | DRAFT
Questions? Brown and Caldwell
PCB Monitoring Considerations Brown and Caldwell | DRAFT
Potential PCB Sources Brown and Caldwell | DRAFT
Potential PCB Sources Brown and Caldwell | DRAFT
Potential PCB Sources Brown and Caldwell
Potential PCB sources Brown and Caldwell | DRAFT