Download
1 / 50
500 likes | 670 Views
Gistutorial for Health Lecture 8 Approximate Methods for Transferring Data. Lecture 8 Outline. Simple Apportionment Visual Basic Scripts Advanced Apportionment Model Builder. Simple Apportionment. Apportionment Example.

E N D
Gistutorial for Health Lecture 8 Approximate Methods for Transferring Data
Lecture 8 Outline • Simple Apportionment • Visual Basic Scripts • Advanced Apportionment • Model Builder
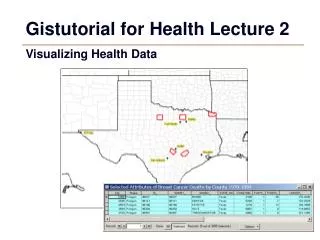
Apportionment Example You want to know the elderly population of a geographic feature (e.g. Health Referral Region) that does not share the same boundary as census features (e.g. Census Blocks) More than a simple spatial join is needed Population is in the SF1 tables and available for census tracts, block groups, and blocks
Population Apportionment • Nebraska Health Referral Regions
Population Apportionment • Overlay census blocks which are non-coterminous with Health Referral Regions
Population Apportionment • Use census block centroids to best estimate the population in each health referral area
Polygon Centroid VB Script • Visual Basic Script • advanced calculation for finding polygon centroids
Polygon Centroid VB Script • Adds X, Y Data to attribute table
Polygon Centroids Export attributes as table Add as XY Data to map
Spatially Join Polygons to Blocks • Health Referral Areas toCensus Blocks
Aggregate Census Data by Health Referral Region • Summarize HRR Data
Other Census Data to Apportion • SF1 Census Data (Simple) • Population (tract, block group, and block) • Age (tract, block group, and block) • Race (tract, block group, and block) • Housing Units (tract, block group, and block) • SF3 Census Data (Advanced) • Educational Attainment (tract and block group only) • Income (tract and block group only) • Poverty Status (tract and block group only) • Others?
Advanced ApportionmentExample • Health policy specialist needs to know the elderly population in poverty by zip code • Challenge: Poverty data is in SF3 table and only available by tract or block group • Blocks have only SF1 data but are better for apportionment • We are assuming that the poverty is uniformly distributed over the senior citizen population—clearly an approximation
Background Data • U.S. Census Block Group Table • Contains data not found in blocks or zip codes (e.g. poverty, income, education) • Block groups include block information in the BLKGRPID field (note: this is normally called STFID)
Background Data • Zip Codes • Target shapefile • Block groups and zip codes do not share boundaries
Background Data • Blocks • Block Centroids • Block Group SF1 data
Spatially Join Zip Codes to Block Centroids using Intersect Tool • Data for apportionment • Zip code polygon features • Block polygon and centroids • SF1 and SF3 data tables
Spatially Join Zip Codes to Block Centroids using Intersect Tool
Spatially Join Zip Codes to Block Centroids using Intersect Tool • Block Centroids will not have zip codes
Mid Function • New block centroid shapefile needs the Block Group ID • Mid function will calculate a subset of a value • You have the following data in the BLKID field and want extract 12 characters in the middle, starting from the 1st character
Calculate Using Mid Function New field withfirst 12 characters
Join Blocks to Block Centroids by Zip • Census blocks have data for population 65 and up • Need to join the block-level attribute POP_65_UP to BlockCentroidsXZip
New field in BlockCentroidsxZip • Create a new permanent field in BlockCentroidsXZip, called Indicator, that hasthe values of POP_65_UPso that you can remove thejoin • Simplifies andspeeds up later work
Create another new field in BlockCentroidsXZip • IntID (meaning Intersection ID) • Concatenates BlkGrpID with Zip
Remove Blocks Join • No longer needed New field is a combinationof BlockGroupID and ZIP
Summarize Indicator field by IntID • Aggregate (sum) data using Dissolve
Add Denominator Field to Weight Apportionment • Denom (Age 65 Up)
Examine Blocks_Dissolve’s attribute table • The apportionment weights for the first five block groups—310550002003 through 310550002006—are all 1 because those block groups are entirely inside zip code 68112. • Block group 31050003001, however, is split up between two zip codes. Eleven out of 47 senior citizens (weight = 0.234) are in zip code 68110 and the remaining 36 out of 47 (weight = 0.766) are in zip code 6811.
Calculate Apportionment Weights • Weight = Sum_indiactor/Denom • Sum_indiactor = sum of POP_65_Up by each block group and ZIP Code- intersected polygon • Denom = Age 65 Up
Add and Calculate Field • For elderly population (65 plus) in poverty
Examine Blocks_Dissolve’s Attribute Table • See how the weights have split up the SF3 value for block group 31050003001. Remove the current join between Blocks_Dissolve and BlkGrpSF3.
Add and Join to Zip Codes • Finished Choropleth Map
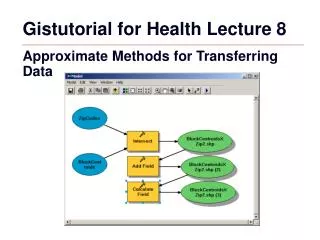
Model Builder • Workflow processes can be complicated • Automates and strings functions together
Model Builder Example • Problem: • You have census block centroids with population data and want population by zip code • Solution: • Use Model Builder functions to intersect block centroids and zip codes and add/calculate a field for block group ID using the “mid” function
Add to the Model • You can keep adding steps from the interactive ones done earlier in this tutorial until all of apportionment is carried out in the model. • If you need to run the model in a new context, you can edit the model, open parameter forms, and make adjustments, such as changing the names of files or field names.
Lecture 8 Summary • Simple Apportionment • Visual Basic Scripts • Advanced Apportionment • Model Builder