Demographic Transition Model 10 /8
140 likes | 684 Views
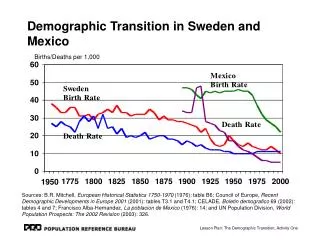
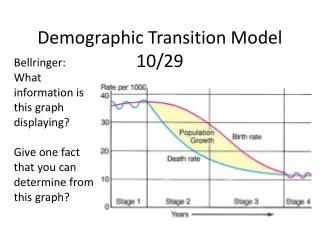
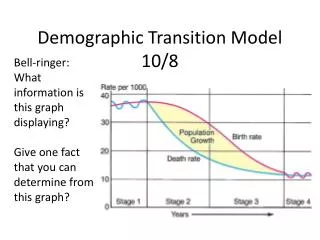
Bell-ringer: What information is this graph displaying? Give one fact that you can determine from this graph?. Demographic Transition Model 10 /8. Stages in Classic 4-Stage Demographic Transition Model (DTM) (Some mention a new 5th stage). Stage 1: “Pre-Industrial”

Demographic Transition Model 10 /8
E N D
Presentation Transcript
Bell-ringer: What information is this graph displaying? Give one fact that you can determine from this graph? Demographic Transition Model10/8
Stages in Classic 4-Stage Demographic Transition Model (DTM) (Some mention a new 5th stage)
Stage 1: “Pre-Industrial” High birth rates and high death rates (both about 40) NIR = 0 or very slow rate No country or world region still in Stage One. STAGE ONE – Agrarian society, lots of deaths from famine and disease.
Stage 2: “Early Industrial” High birth rates (over 30) but death rates begin to decline(to about 20) NIRsincrease sharply (pop. explosion); growth rate increases throughout Stage Two Growth not from increase in births, but from decline in deaths MDCs = starts early 1800s LDCs = starts after 1950s
Why move from Stage 1 to Stage 2? • REMEMBER – the question is…. Why would more people live longer (lower CDR), NOT why would more people be born (higher CBR)?
Stage 3: “Later Industrial” Birth rates decline sharply (to about 15) and Death rates decline a bit more (to about 10 or less) Pop. Growth occurs, but at a reduced and declining rate MDCs = starts in late 1800s LDCs = starts after 1980s* * Or hasn’t started yet
Why move from Stage 2 to Stage 3? • REMEMBER – the question is…. Why would the birth rate drop rapidly once the CDR has been reduced? • Why would this happen at different times in MDC and LDC?
Stage 4: “Post-Industrial” Birth rates and death rates both low (about 10) Population growth very low or zero (ZPG – zero population growth) MDCs = starts after 1970s LDCs = hasn’t started yet Much of Europe now or soon in population decline as birth rates drop far below replacement level
Population Pyramids: 5 things you notice. What does this image show you?
Analyze this graph: 5 things you notice. What is DIFFERENT about this pyramid?
Vertical axis: Age groups Elderly Dependents Working populations Young dependents Horizontal Axis:Percentage/number people
Dependency Ratio – Ratio of dependents to the working population • SO WHAT?