Download

1 / 32
320 likes | 581 Views
SKF Nine-month results 2011. Tom Johnstone, President and CEO 19 October 2011. Q3 2011. Strong performance 2011 2010 Operating profit, SEKm 2,479 2,309 Operating margin, % 15.0 14.9 Profit before tax, SEKm 2,345 1,950 Cash flow, SEKm 1,323 1,936

E N D
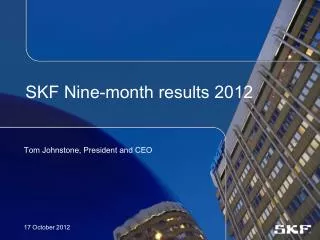
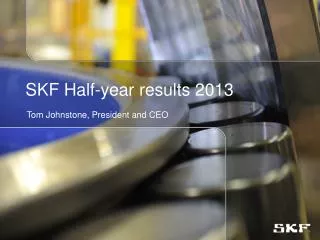
SKF Nine-month results 2011 Tom Johnstone, President and CEO 19 October 2011
Q3 2011 • Strong performance 2011 2010 • Operating profit,SEKm 2,479 2,309 • Operating margin, % 15.0 14.9 • Profit before tax, SEKm 2,345 1,950 • Cash flow, SEKm 1,323 1,936 • Strong organic sales growth in local currency: • SKF Group: +8.2% • Europe: +9.7% Industrial Division: +7.1% • North America: +9.9% Service Division: +12.5% • Asia: +4.9% Automotive Division: +3.2% • Latin America: +10.2% • Outlook for Q4 for SKF Group • Demand • Relatively unchanged compared to Q4 2010 • Slightly lower sequentially compared to Q3 2011 • Manufacturing level • Lower year over year and compared to Q3 2011
Highlights Q3 2011 • SKF • opened regional distribution centre in Montevideo, Uruguay to strengthen the service to customers and distributors in Latin America. • • inaugurated bearing factory in Dalian, China for medium size bearings. • • was selected to be a member of Dow Jones’ Sustainability World indexes for the 12th successive year and for the 11th successive year in the FTSEGood Index Series.
Example of new products • A new range of seals for wind turbine drive trains. A new bearing range, mainly developed for industrial fans, textile equipment and conveyors. These energy efficient Y-bearings give a 50% reduction in the bearing frictional torque vs conventional SKF Y-bearings. An upgraded range of SKF Explorer spherical roller bearings which offers at least twice the previous life when operating in a contaminated environment. SKF Solar Linear Actuators designed specifically to meet the solar tracking technical requirements.
Sales volume % change y-o-y 2009 2010 2011
Organic growth in local currencies % change y-o-y 2010 2011 2009
Growth development by geography Organic growth Q3 2011 vs Q3 2010 Europe+9.7% North America +9.9% Asia/Pacific +4.9% Latin America +10.2% Middle East & Africa +0.2%
Growth development by geography Organic growth YTD 2011 vs YTD 2010 Europe+15.1% North America +16.5% Asia/Pacific +14.0% Latin America +10.1% Middle East & Africa +5.3%
Growth in local currency Long-term target: 8% per annum 14.2% 19.2% -19.0% Total growth % y-o-y 14.2% 14.4% 4.8% 1.0% 0.0% -20.0% Organic growth Acquisitions/Divestments
Components in net sales 2009 2010 2011 Percent y-o-y
Operating profit SEKm 2011 2010 2009 Restructuring and one-time items
Operating margin Long-term target level: 15% % 2009 2010 2011 Restructuring and one-time items
Operating margin Long-term target level: 15% % 15.2 14.2* 13.8 8.0* 5.7 Restructuring and one-time items * Excluding restructuring and one-time items
Operating margin per division % Service Industrial Automotive 2010 2011 2009 Excluding one-off items(eg. restructuring, impairments, capital gains)
Inventories as % of annual sales Long-term target level: 18% % 2009 2010 2011
Cash flow, after investments before financing SEKm Cash out from acquisitions (SEKm): 2009 241 2010 6,799 2011 6 * 2010 2011 2009 * SEK 798 million,excluding the acquisition of Lincoln Industrial.
Return on capital employed Long-term target: 27% % 25.1 24.0 9.1 ROCE: Operating profit plus interest income, as a percentage of twelve months rolling average of total assets less the average of non-interest bearing liabilities.
Net debt(Short-term financial assets minus loans and post-employment benefits) SEKm AB SKF, dividend paid (SEKm): 2009 Q2 1,594 2010 Q2 1,594 2011 Q2 2,277 Cash out from acquisitions (SEKm): 2009 241 2010 6,799 2011 6 2010 2011 2009
Debt structure Maturity years, EURm 500 396 1) 130 110 2) 100 100 0 0 • Credit facilities: EUR 500 million 2014 SEK 3,000 million 2017 • No financial covenants nor material adverse change clause • Changes in Q3 • 1) EUR 50 million repaid 2) SEK 1 billion raised
October 2011: Outlook for the fourth quarter 2011 • Demand compared to the fourth quarter last year • The demand for SKF’s products and services is expected to be relatively unchanged • for the Group. It is expected to be slightly lower in Europe, relatively unchanged in North America and slightly higher in Asia and Latin America. The demand is expected • to be slightly higher for the Industrial Division, higher for the Service Division • and lower for the Automotive Division. • Demand compared to the third quarter 2011 • The demand for SKF’s products and services is expected to be slightly lower for the Group. It is expected to be slightly lower for Europe, relatively unchanged for Asia • and North America, and slightly higher for Latin America. The demand is expected • to be relatively unchanged for the Industrial Division and the Service Division, and slightly lower for the Automotive Division. • Manufacturing level • The manufacturing level is expected to be lower year on year and compared to the third quarter.
Sequential volume trend main segments Q4 2011(based on current assumptions) Share of net sales 2010
SKF today – more robust and more diverse Divesting and outsourcing component manufacturing, reducing fixed cost and invested capital Manufacturing footprint in best cost countries Reducing working capital Customized solutions, value-added products, technology platforms Diversifying growth, faster growing segments and geographies Acquisitions supporting growth and profitability
SKF today - prepared for a changing demand picture • Activities already underway • The SKF 3C programme has been re-emphasisedCustomers: - increase customer and distributor contacts • - ensure a very good service level • - utilise opportunities from our platform/segment approach • - maintain strong commitment to R&D – especially energy efficiency • Cost: - strict cost control (which has no customer impact) • - review further permanent changes to the cost structure • Cash: - strong cash flow focus • Adjustment of manufacturing output to demand situation • use flexibility in the working hours through: • - time banks • - temporary workers • - government supported schemes • - short-time working agreements • Review of investment plan and timingmaintain investment plan for faster growing areas • Strong focus on faster growing regions and segments is maintained
Guidance for the fourth quarter 2011 • Tax level: around 30% • Financial net for the fourth quarter:Around SEK -175 m • Exchange rates on operating profit versus 2010 Q4: SEK -100 m • Full year: SEK -1.2 bn • Additions to PPE: Less than SEK 2.0 bn for 2011 Guidance is approximate and based on current assumptions and exchange rates.
Key focus areas ahead 2011 • Profit and cash flow • - manage currency and material headwinds • Manufacturing and suppliers to support demand • Growing segments and geographies • Initiatives and actions to support long term targets • Integration of Lincoln Industrial • Business Excellence and competence development One SKF and SKF Care as guiding lights
Cautionary statement • This presentation contains forward-looking statements that are based on the current expectations of the management of SKF. • Although management believes that the expectations reflected in such forward-looking statements are reasonable, no assurance can be given that such expectations will prove to have been correct. Accordingly, results could differ materially from those implied in the forward-looking statements as a result of, among other factors, changes in economic, market and competitive conditions, changes in the regulatory environment and other government actions, fluctuations in exchange rates and other factors mentioned in SKF's latest annual report (available on www.skf.com) under the Administration Report; “Important factors influencing the financial results", "Financial risks" and "Sensitivity analysis”.