Download
1 / 5
50 likes | 112 Views
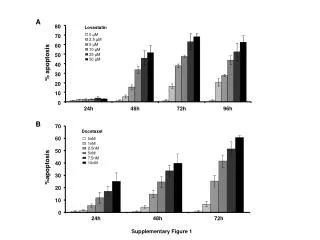
This study investigates the impact of Lovastatin combined with Docetaxel on apoptosis at various concentrations and time points in HeLa, HepG2, and H322 cells. Caspase 3/7 activity is measured to assess cell death mechanisms. The results show a synergistic effect on apoptosis induction.

E N D
Lovastatin 0 µM 2.5 µM 5 µM 10 µM 25 µM 50 µM 80 % apoptosis 70 60 50 40 30 Docetaxel 0nM 20 24h 48h 72h 96h 1nM 2.5nM 5nM 10 7.5nM 10nM %apoptosis 70 0 60 50 40 30 20 10 0 24h 48h 72h A B Supplementary Figure 1
14 12 10 8 Caspase 3/7 activity (arbitrary units) HeLa 6 4 2 0 control L 12.5µM D 5nM L 12.5µM + D 5nM 9 8 7 6 HepG2 5 Caspase 3/7 activity (arbitrary units) 4 3 2 1 0 control L 12.5µM D 5nM L 12.5µM + D 5nM 9 8 7 6 5 24 h Caspase 3/7 activity (arbitrary units) H322 48 h 4 3 2 1 0 control L 12.5µM D 5nM L 12.5µM + D 5nM Supplementary Figure 2
80 † † # # 70 *** † † # # # 60 *** *** 50 *** 40 % apoptosis 30 20 *** 10 0 L 12.5µM + V 0.5nM L 12.5µM + V 1nM control L 12.5µM V 0.5nM V 1nM Supplementary Figure 3
# # # *** 45 HGT-1 *** 40 HGT-1-D5 *** 35 30 % apoptosis 25 20 15 10 5 0 vinblastine +verapamil control verapamil vinblastine Supplementary Figure 4
HGT-1 HGT-1-D5 Supplementary Figure 5


