Download
1 / 16
160 likes | 249 Views
Investigating particle transport coefficients in HT-7 plasma through density modulation, providing insights into particle confinement characterizations and experimental difficulties resolution.

E N D
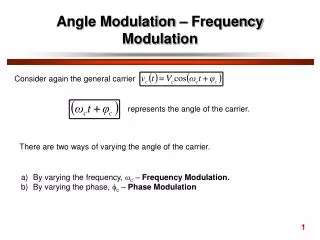
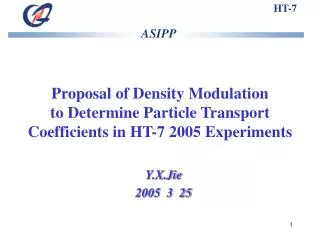
HT-7 ASIPP Proposal of Density Modulation to Determine Particle Transport Coefficients in HT-7 2005 Experiments Y.X.Jie 2005 3 25
HT-7 Outline • Background and motivation • Principleof the measurement • Experiments and resultsin 2004 • What to do in 2005
HT-7 Background and motivation Particle confinement study is a very important issue for magnetically confined plasmas. However, only less number of the studies is reported, compared with energy transport study. This is due to the technical difficulty of the estimation of the particle source and existence of the convection term. Density modulation is a powerful approach to solve these experimental difficulties. Periodic gas fueling induces periodic density modulation. The induced density modulation propagates from edge region to core region. The propagation tells us particle confinement characteristics. It should be noted that the absolute value of particle source is not necessary for this analysis, and the shape of particle source is required.
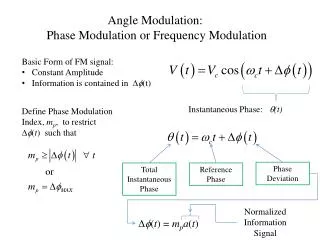
HT-7 Principle of measurement The particle balance equation: where n, Γ, S, D and V are electron density, particle flux, particle source rate, particle diffusion coefficient and convection velocity, respectively.
HT-7 ASIPP Here, we assume the equilibrium and modulated components are independent, and separate these two components as follows, where ω is the modulation angular frequency. Then, the following particle balance equations for modulated components are obtained from eq.(1),
HT-7 ASIPP Because of the limit of the interferometer chord number, simple model is used for the analysis. Diffusion coefficient D is assumed to be spatially constant. Convection velocity is assumed to be zero at plasma center and increase proportionally to minor radius: V(r) = (r/a)V0 Since an interferometer measures path integration of modulated density propagation, the integration of and in eq. (5) are compared with the measured one, changing model of D and V so that the calculated amplitude and phase should agree well with the measured ones. The value of D and V0 are scanned. For each D and V0, NL in eq. (5) are calculated. Then, the difference between the experimental and calculated values is calculated to minimize the following equation,
HT-7 Experiments and results in 2004 Waveformwith/withoutdensity modulation status Ip~130kA Ne3~1.5,3.0 It~3800A Modulation frenquency:10Hz amplitude: 10%
HT-7 Modulationat (a) low density (1.5x10¹⁹m-3 ) and (b) high density (3.0x10¹⁹m-3 ) Time trace of the line averaged density in a typical ohmic discharge at (a) low density (1.5x10¹⁹m-3 ) shot 67938 and (b) high density (3.0x10¹⁹m-3 ) shot 67941 , where Bt=1.8T, Ip=130kA, . From upper to down traces correspond to R=0, 0.1, and 0.2m, respectively.
HT-7 Contour plot of c2 for (left) low density and (right) high density discharges The minimum point is indicated with a cross symbol. 67941 ne=3.0x10¹⁹m-3 67938 ne=1.5x10¹⁹m-3 V(-10~10m/sec) V(-10~10m/sec) D(0.05~0.6m2/sec) D(0.05~0.6m2/sec)
HT-7 Estimated D and V in low and high density background Positive and negative V indicate outward and inward convection, respectively. The lower diffusion at higher density is observed, as similar to the results on other tokamaks(TEXT,ASDEX,JT60U). The outward directed convection is observed at low density discharge. This is different from the previous results in other tokamaks.
HT-7 (D,V) vs Ne V vs Ne D vs Ne
HT-7 Ne profile at high density (3.0x10¹⁹m-3 ) The shape is similar Without modulation With modulation
HT-7 Total stored energy (kJ) The difference is less than 5% Ne=1.5 Ne=3.0
HT-7 Te by sxs(Ne=1.5x10¹⁹m-3) The difference is about 0.2kev 67908#,no modulation 67938#,modulation
HT-7 What to do in 2005 1. Density scanning from 1x10¹⁹m-3 to 4 x10¹⁹m-3.(Ip =130kA, Ohmic discharge) 2. Density modulation in LHCD ,IBW or synergy of LHCD and IBW with improving confinement. 3. If possible , scan Te .
HT-7 ASIPP THANK YOU!