Download
1 / 26
260 likes | 404 Views
Health Services Advisory Group, Inc. Performance Improvement Projects Nursing Home Diversion Program Where Are We Now? Concurrent Breakout Session #2 Florida EQR Quarterly Meeting June 18, 2008. Presented by: Cheryl L. Neel, RN, MPH, CPHQ Manager, Performance Improvement Projects. Study Topic.

E N D
Health Services Advisory Group, Inc. Performance Improvement ProjectsNursing Home Diversion ProgramWhere Are We Now?Concurrent Breakout Session #2Florida EQR Quarterly MeetingJune 18, 2008 Presented by: Cheryl L. Neel, RN, MPH, CPHQ Manager, Performance Improvement Projects
Study Topic Retention Rate was chosen as a collaborative PIP for the NHDPs. Without the services provided by the NHDPs, the enrollees would have no choice but to receive care in an institutional setting such as a nursing home. The goal is to maintain the enrollees in the least restrictive environment.
Study Question Will interventions by NHDP case managers result in an increase in retention rates of Diversion enrollees?
Study Indicator Numerator: Number of enrollees in the denominator who were still enrolled with the NHDP at the end of the measurement period. Denominator: Number of enrollees enrolled in the NHDP at any time during the measurement period.
Study Population Synopsis of study population: • All Diversion enrollees will be included in the study. • Enrollees will not be identified by age or gender. • Enrollees will be excluded from the denominator if they were involuntarily disenrolled during the measurement period. Disenrollments are identified as (not inclusive) death, not eligible for Medicaid, etc.
Study Population Synopsis of study population (continued): • Enrollees will be included if they are continuously enrolled for at least one month during the measurement period. • One two-month gap is allowed during the measurement period.
Where Are We Going?Collaborative NHDP PIPImproving Retention Rates Debbie Lynott, American Eldercare, Inc. June 2008
What Are Our Goals? PIP by individual diversion contractors? PIP with group data of all diversion contractors? PIP with both individual and group data of all diversion contractors?
Why Do Members Voluntarily Disenroll? Moving to out-of-network nursing home Moving to an out-of-network ALF Transferring to a new provider Dissatisfied with services No longer wishing to participate in diversion program
Defining the Disenrollment Reasons? Moving to out-of-network nursing home Moving to an out-of-network ALF Transferring to a new provider Dissatisfied with services No longer wishing to participate in diversion program
Moving to an Out-of-Network SNF Internal Factors: Diversion contractor can not agree to rates Diversion contractor does not want to contract with the SNF SNF refuses to contract based on a previous problem with the diversion contractor Other? External Factors: Nursing home refuses to work with diversion contractor Diversion contractor identified that the member could be cared for safely in a less- restrictive environment Other?
Moving to an Out-of-Network ALF Internal Factors: External Factors:
Transferring to a New Provider Internal Factors: External Factors:
Dissatisfied with Services Internal Factors: External Factors:
No Longer Wishing to Participate in Diversion Program Internal Factors: External factors:
Designing a Data Collection Form (Example) DATA COLLECTION FORM–DIVERSION COLLABORATIVE STUDY RETENTION RATES To be completed by assigned diversion employees after the disenrollment form is received. This form must be completed and submitted to ___________Dept. for all voluntary disenrollments. Moving to an out-of-network SNF (pick one of the reasons below) Diversion contractor cannot agree to rates Diversion contractor does not want to contract with the SNF SNF refuses to contract based on a previous problem with the diversion contractor Nursing home refuses to work with diversion contractor Diversion contractor identified that the member could be cared for safely in a less-restrictive environment Other ____________________________________________________
Health Services Advisory Group, Inc. Performance Improvement ProjectsNursing Home Diversion ProgramDeveloping a Data Analysis PlanConcurrent Breakout Session #2Florida EQR Quarterly MeetingJune 18, 2008 Presented by: Cheryl L. Neel, RN, MPH, CPHQ Manager, Performance Improvement Projects
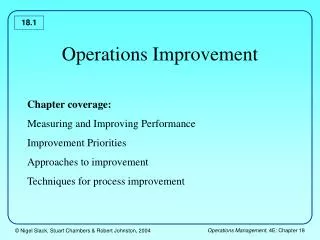
Activity 8. Data Analysis and Interpretation Evaluation Element 1. The data analysis is conducted according to the data analysis plan in the study design.
Data Analysis Plan What is the importance of a data analysis plan? Answers: • A data analysis plan outlines how you will statistically answer your study question. • By developing a data analysis plan before you collect data, potential data issues may be avoided.
Data Analysis Plan What questions will help in the development of a data analysis plan? Answers: • Are the study indicators broken down by age, county, or region? • What type of statistical testing am I going to use? • With a rate, am I going to report the numerator and denominator? • With a mean, am I going to report out the standard deviation, the minimum, and the maximum?
Data Analysis Plan Answers (continued): • Is it best to use a graph to display the results? or • Is it best to use a table to display the results? • What statistical test am I going to use to compare my baseline to remeasurement?
Data Analysis Plan What are the final steps in creating a data analysis plan? Answer: Once all the above questions have been answered, organize your answers into a plan that clearly outlines each step of your analysis and how the results will be presented.
Data Analysis Plan Short example of a data analysis plan: “Retention rates for all NHDP enrollees will be analyzed. The rates will be displayed in tabular format including numerators and denominators. Chi-square statistics will be calculated, as well as p values indicating differences between baseline and measurement years. The p values indicating a statistically significant change will be bolded with an arrow indicating which direction the change occurred.”