Transportation Funding
Transportation Funding. Federal, State, and Local Funding of Transportation Infrastructure Presented by Nathan Barrett Senior Transportation Planner, PAG September 14, 2016. Presentation Overview. General Concepts Federal Funding State Funding RTA Funding Post-Recession Trends.

Transportation Funding
E N D
Presentation Transcript
Transportation Funding Federal, State, and Local Funding of Transportation Infrastructure Presented by Nathan Barrett Senior Transportation Planner, PAG September 14, 2016
Presentation Overview • General Concepts • Federal Funding • State Funding • RTA Funding • Post-Recession Trends
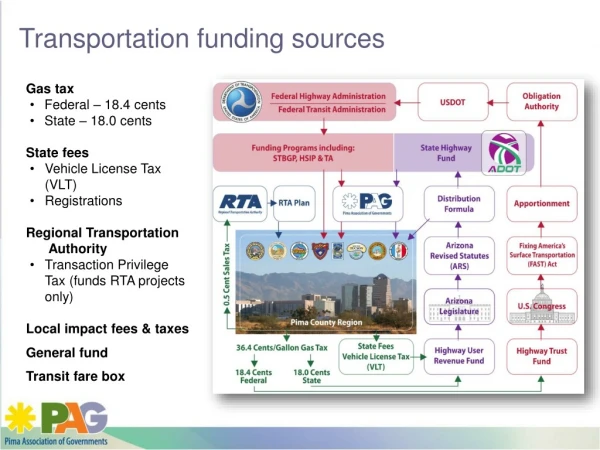
General Concepts • Roles and Responsibilities of PAG • Gas and fuel taxes • Costs of transportation infrastructure
What is PAG? • Est. in 1970, Pima Association of Governments is a nonprofit metropolitan planning organization with three divisions: • Transportation Planning • Sustainable Environment • Technical Services
PAG Governance 9-member Regional Council
Planning for Multiple Transportation Modes
Key Documents 2045 Regional Mobility and Accessibility Plan 20-year Regional Transportation Authority 5-year Transportation Improvement Program (TIP)
Gas and Fuel Taxes • Federal and State Taxes • Federal tax: 18.4 cents per gallon • State tax: 18 cents per gallon • Tax per gallon, not per dollar • Proxy user fee • Unsustainable • Not indexed to inflation • Increasing fleet fuel efficiency eroding proxy relationship
Total Gas Tax paid per 1,000 miles driven for Popular Makes and Models—1992 vs 2016 Source: http://www.fueleconomy.gov/feg/make.shtml
Costs of Transportation Infrastructure • Example of a large scale project: • Traffic Interchange at Ina Road and I-10 • Construction cost estimated at $100 million • Example of a small scale project: • Average HAWK Pedestrian crossing • $250 thousand
Long-Range Transportation Plan:Financial Plan • Estimates $17.1 billion in transportation revenues over the next 30 years • Seven categories of funding • Federal ($741 million) • State ($1,270 million) • Regional HURF ($906 million) • RTA ($3,900 million) • Local ($6,960 million) • Federal Transit ($855 million) • Non-Federal Transit ($2,441 million)
Federal Funding • Transportation Authorization bills • From Authorization to Construction • The FAST Act
Transportation Authorization Bill • Defines the manner in which funds can be drawn from the Highway Trust Fund for a set period of time • Outlines the funding programs and their rules • Authorizes an upper limit on the amount available through each funding program • Describes how funding is distributed to states, MPOs and other agencies
Past Authorizations • Very First: Federal Aid Road Act, 1916 • Most Recent: Fixing America’s Surface Transportation (FAST Act): December 2015 • Other Notable Authorizations: • Intermodal Surface Transportation Efficiency Act (1991) • Safe, Accountable, Flexible, Efficient, Transportation Equity Act: A Legacy for Users (2005) • Moving Ahead for Progress in the 21st Century (2012)
Authorization Expiration? • New projects cannot obligate funds from the Highway Trust Fund • Congressional conflict has resulted in the need for multiple short-term extensions since SAFETEA-LU expired. • Uncertainty about future funding obstructs the planning process and delays project delivery
Short-Term Extensions • SAFETEA-LU: 10 short-term extensions • Period of 2 years and 9 months • October 2009 - July 2012 • Ranged in length from 1 week to 9.5 months • MAP-21: 5 short-term extensions • 1 year and 2 months • October 2014 – December 2015 • Ranged in length from 2 weeks to 8 months • Four of the six years prior to the FAST Act
From Authorization to Project • Spending from the Trust Fund is authorized • Funding is appropriated by Congress • Congress determines an Obligation Authority (how much of the appropriation can be spent) • Programmed by regional MPO • Project sponsor authorized to be reimbursed from Trust Fund (funds are obligated)
Apportionments STP NHPP HSIP CMAQ PL
Appropriations STP NHPP HSIP CMAQ PL
Obligation Authority (OA) tells you how much you can actually “spend” (obligate) of your authorized appropriation.
FAST Act: Overview • Signed into law on Dec. 4, 2015 • $280 billion over five years • Starts, retroactively on Oct. 1, 2015 • Expires on Sept. 30, 2020 • Required $75 billion to be transferred from General Fund to the Trust Fund
FAST Act: Structure • Apportioned programs • Programs that use a formula to calculate amounts apportioned to each state • Non-Apportioned programs • Competitive grants, research funding, pilot programs, etc. • Transit Funding
FAST Act: Arizona by Fiscal Year • 2015 (Actual): $706.2 million • 2016: $742.2 million • 2017: $757.5 million • 2018: $773.9 million • 2019: $791.3 million • 2020: $810.3 million • 2015 vs. 2020: 14.7% increase
FAST Act Funding: Unsustainable • Highway Trust Fund collections slowing • Gas and Diesel taxes • A few miscellaneous other fees • General Fund transfers either one-time sources or very small amounts • Federal Reserve Surplus Account Transfer • Sales from Strategic Petroleum Reserves • Index Custom Fees • Other miscellaneous pay-fors
Highway User Revenue Fund • Sources • Distributions • Recent trends and issues
HURF Sources: $1,290 M in 2015 • Highway User Revenue Funds come from: • Gasoline taxes ($470.9 million) • Diesel taxes ($184.5 million) • Vehicle license tax ($369.7 million) • Registration Fees ($168.6 million) • License fees ($25.1 million) • Motor carrier fees ($40.2 million) • Other miscellaneous fees ($31.4 million)
HURF Distribution • Roughly half to: • Cities, Towns, and Counties • State Highway Fund • State Highway Fund • 15% for arterials in Maricopa and Pima County • Debt service, MVD, etc. • ADOT Operating budget
HURF Transfers • State statute authorizes two transfers to the Department of Public Safety • $10 million from the HURF • $10 million from SHF • Recent state budgets have diverted more than the statutory $20 million • $103.7 million from most recent budget
RTAFunding • RTA Project Update • RTA Funding Trends
RTA Project Update • 759 completed projects or services • 70 projects are under construction • 92 projects currently in design or planning
RTA Safety Element Projects • 164 Intersection projects completed (200 promised) • 54Pedestrian Crossings completed (80 promised) • 108 Bus Pullouts completed (200 promised)
Other RTA Projects Environmental & Economic Vitality Element • 244 miles of bike lanes completed (550 promised) • 147 miles of sidewalk completed (250 promised) • 95 miles of exist. sidewalk now accessible
RTA Enhancements include additional Weekend, Evening, Peak Hour, Express Service, plus Park & Ride sites, Fare collection, Maintenance Facility & Rebranding improvements
Regional Transportation Spending RTA contributed an average of $88M per year since 2006 RTA State HURF 12.6% Federal Surface Transportation Program Image sources: PAG/RTA
Factors of Change Millennials less likely today to have Driver’s Licenses Millennials are showing a greater preference for urban living Greater use of technology and online commerce in general
Fleet Fuel Efficiency Is Now Improving Source: Light-Duty Automotive Technology, Carbon Dioxide Emissions, and Fuel Economy Trends: 1975 Through 2015. EPA , December 2015
Factors of Change • Vehicle Miles of Travel (VMT) Declined following the Recession, but are increasing again • Economy, conservation ethics and electronic devices all factors. • Vehicle Fuel Efficiency Increasing • Vehicles now growing in efficiency instead of size • Even heavy trucks seeing improved efficiency • Energy Production • US going from largest oil importer to potentially a large exporter within the span of a decade; oversupply has resulted in falling fuel prices Will increased production/reduced prices have a long term impact on demand?
Challenges and Opportunities Ahead • Preserving our existing infrastructure • Support for economic development & recovery • Looking beyond 2026 – What should we be planning for? • Should we look at different ways to fund our roads? • Our biggest current • need is to address • deferred maintenance
Improving transportationand bringing economic vitality to our region. Questions?