Development of PacIOOS Modeling Systems for Oceanography and Meteorology
230 likes | 356 Views
The SOEST contribution to PacIOOS involves the development of advanced modeling systems for ocean circulation and atmospheric conditions. By employing models like NLOM, NCOM, and HYCOM, the initiative delivers real-time nowcast and forecast estimates that aid various applications, including search and rescue operations, ocean recreation, and travel. Our approach integrates atmosphere, ocean circulation, and wave models to synthesise observations and improve prognostic capabilities. The work is aimed at enhancing regional model outputs while addressing operational responsibilities and engaging the research community.

Development of PacIOOS Modeling Systems for Oceanography and Meteorology
E N D
Presentation Transcript
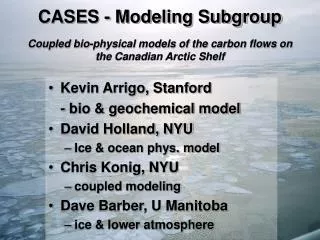
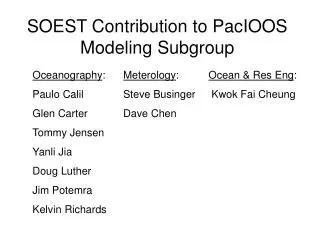
SOEST Contribution to PacIOOSModeling Subgroup Oceanography: Paulo Calil Glen Carter Tommy Jensen Yanli Jia Doug Luther Jim Potemra Kelvin Richards Meterology: Steve Businger Dave Chen Ocean & Res Eng: Kwok Fai Cheung
Model-based products Model Systems Users Nowcast estimates of upper ocean circulation Ocean circulation • Search and rescue • Ocean recreation • Travel/transportation • Wave/run-up/tracer models • Weather forecasters • Policy/planning • Research community Forecast estimates of atmospheric conditions Nowcast and forecast estimates of wave/water level Atmosphere Synthesis of ocean observations via data assimilation Wave/water level Forecast estimates of upper ocean circulation
1. Product Development: initial effort construction of regional nowcast maps of ocean circulation based on daily downloads of operational models run by/at NRL Stennis • NLOM (3.4 km, 100m upper layer, 200m isobath, assimilates SSH) • NCOM (14 km, 40-levels, 5m isobath, assimilates T/s from NLOM/MODAS) • Notes: • These models will be replaced by HYCOM (9 km) at the end of 2007 (mandate is end of FY08) • Will require DM/web work rather than modeling expertise • Can be done quickly and inexpensively • IPRC/APDRC activity leverage • Frees SOEST from operational responsibilities • Not ideal for tracer/trajectories nor research • ¼ FTE for technical support
2. Product Development: local model Integration of three locally-run modeling subsystems: atmosphere (MET), ocean circulation (IPRC), wave/water level (ORE) • Wave model up and running; already operational • Atmospheric model up and running; already operation; not ideal model • Ocean model(s) under development
Wave model system Upper-ocean currents Atmospheric forcing Wave Watch 3 Global, 1x1 degree Wave Watch 3 Regional, 10x10 km SWAN Island-region, 100x100 m Wave and water levels
Atmospheric model system Global Forecast System NCEP WRF Nested to 1x1 km (TBA) RSM/MSM Regional 10x10 km (Chen/Businger) RSM/MSM Island-domain 1x1 km (Chen/Businger) • Surface forcing • Weather forecasting
Atmospheric model system Global Forecast System NCEP WRF Nested to 1x1 km (TBA) RSM/MSM Regional 10x10 km (Chen/Businger) RSM/MSM Island-domain 1x1 km (Chen/Businger) • Surface forcing • Weather forecasting
Ocean model system Global HYCOM NRL Surface forcing MET Observations PacIOOS/DMAC Regional (5x5 km) HYCOM IPRC (Jia) Regional (125x125 m) POM IPRC (Jensen) Regional (variable) ROMS IPRC (TBA) • Ocean currents • Sea level • Transports • Synthesized observations • Research activities
Ocean model system Global HYCOM NRL Surface forcing MET Observations PacIOOS/DMAC Regional (5x5 km) HYCOM IPRC (Jia) Regional (125x125 m) POM IPRC (Jensen) Regional (variable) ROMS IPRC (TBA) • Ocean currents • Sea level • Transports • Synthesized observations • Research activities
Model development timeline • Wave model • Maintain (now) • Atmospheric model • Maintain (now) • Upgrade to WRF (end year 1) • Coupled model (in year 3) • Ocean models: • Serve operational model output (in year 1) • Continue HYCOM (products end year 1) • Continue POM (products in year 1) • Develop ROMS (year 2-3) • Coupled model (in year 3-out)
Ocean models • Serving operational model • Immediate -- Insufficient resolution • Run elsewhere • Continue regional models • Experience -- Need resources • Underway -- Not yet operational • Experiments -- Rely on atm and global model • Research capable • Tracer/trajectories • Configurable
Ocean models, cont’d • HYCOM • Fits global model -- Expensive • Experience -- Rely on NRL • Advanced physics -- Small user base • POM • Experience -- Few modules • Large user base -- BC’s • Efficient -- Very small domain • ROMS • Large user base -- Not yet tested here • Many modules -- BC’s • Easy to configure • Used in other regions
ModelPersonnelMonths/year$K/year Atm model programmer/tech/pdoc 12/12/12 90/90/90 TOTAL 90/90/90 Wave model programmer/tech/pdoc 12/12/12 90/90/90 TOTAL 90/90/90 Ocean model HYCOM Jia (model devel) 03/02/02 45/30/30 Yaremchuk (data assim) 02/02/01 30/30/15 Potemra (man/eval) 01/01/01 15/15/15 POM Jensen (model devel) 03/02/02 45/30/30 Potemra (man/eval) 01/01/01 15/15/15 ROMS prog/tech/pdoc (model devel) 12/07/05 60/35/25 Yaremchuk (data assim) 01/02/01 15/30/15 Potemra (man/eval) 01/01/01 15/15/15 TOTAL 240/200/160
Resources, cont.’d Year 1Year 2Year3 Ocean model 240 200 160 Atm model 90 90 90 Wave model 90 90 90 Equipment1,2 120 0 40 • LOI listed equipment under Ocean model • Cluster/disks in yr1, upgrade to disks yr2
Miscellaneous Concerns • Rely critically on DM component for data storage and transport • Rely on linkages for product development (DM group?) • Model evaluation • Integrate research activities • Determine necessary and sufficient grid spacing, domain boundary (balance with runtime)
NOAA PRIDE: Nearshore circulation and wave modelling Kaneohe Bay, Oahu 10.8 km x 14.4 km . POM with 123 m x 132 m resolution 11 vertical topography following levels (resolution: 5 cm to 11 m) Depth range: 1 m to 100 m Mellor and Donelan (2006) surface wave model (24 wave directions) Currents and wave field for trade wind conditions (15 m/s). Swell: 3m, 10s Bathymetry
Comparison with tidal data HYCOM dx=0.08o HYCOM dx=0.04o OfES (ECMWF) dx=0.10o OfES (Qscat) dx=0.10o NLOM (NCEP) dx=0.06o
Comparison with T/P data rms SSH variance (2o horizontal smoothing) HYCOM dx=0.08o HYCOM dx=0.04o T/P data OfES (ECMWF) dx=0.10o OfES (Qscat) dx=0.10o HYCOM.04
Cross-validation of the models using SSH Model-data correlations MIT GCM, ‘93-’97, [Lee et al., 2002]