Jason-1
Jason-1. QuikScat. Jason-1 Altimeter IGDR data. Real Time QuikScat Vector wind data. OSCAR Project Organization. NOAA/NESDIS Program Manager Bob Cheney. University of South Florida Gary Mitchum IGDR Processing to Gridded Surface Topography. Florida State University Mark Bourassa

Jason-1
E N D
Presentation Transcript
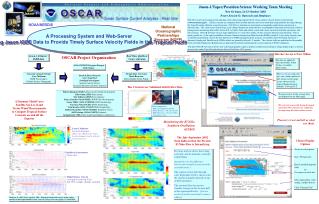
Jason-1 QuikScat Jason-1 Altimeter IGDR data Real Time QuikScat Vector wind data OSCAR Project Organization NOAA/NESDIS Program Manager Bob Cheney University of South Florida Gary Mitchum IGDR Processing to Gridded Surface Topography Florida State University Mark Bourassa Daily Gridded Vector Winds Earth & Space Research Gary Lagerloef Principal Investigator Surface Current Vectors Ground Calibration and Error Analysis The Currents are Validated with Drifter Data Fabrice Bonjean(ESR) Surface current model development; John Gunn(ESR) Data system; Eric Johnson (ESR) Error analysis; Nancy Soreide (NOAA/PMEL) WWW Site Development; Laury Miller (NOAA/NESDIS)ENSO monitoring; Yan Xue (NOAANCEP)ENSO monitoring; Vern Kousky (NOAA/NCEP) ENSO monitoring; Richard Legeckis (NOAA/NESDIS) Instability waves; Jeff Polovina (NOAA/NMFS) Fisheries; Gregg Jacobs (NRL) Navy model assimilation comparisons; Data comparison East-west equatorialcurrent: Mean difference = 10 cm/s (0.2 Kt) RMS difference = 25 cm/s (0.5 Kt) Correlation = 0.82 Jason-1 Altimeter Sea level deviations (These are added to the mean Levitus dynamic height, which is not shown here). QuikScat Scatterometer Vector wind Model Surface Current (averaged over the top 30 m) July 2002 example, spatially smoothed Jason-1/Topex/Poseidon Science Working Team Meeting New Orleans, 21-23 October 2002 Poster Session G; Outreach and Databases OSCAR is a pilot processing system and data center delivering tropical Pacific Ocean surface velocity fields via the Internet (www.oscar.noaa.gov). Surface currents are computed from satellite altimeter and vector wind data using methods developed during the Topex/Poseidon altimeter research mission. OSCAR is a transition to operational oceanographic applications using Jason-1 altimeter data. The various uses include large scale climate diagnostics and prediction, oceanographic education and research, fisheries management, monitoring debris drift, larvae drift, oil spills, fronts and eddies, search and rescue, naval and maritime operations, and idle curiosity. OSCAR provides velocity maps updated on a 1-week basis within 10 days of Jason altimeter measurements. This is made possible by (1) the rapid availability of Jason-1 Interim Geophysical Data Records (IGDRs) within 2-3 days delay from the time of satellite measurement, and (2) the fact that Jason-1 IGDR data approach the accuracy of scientific Topex/Poseidon and Jason-1 altimeter Geophysical Data Records (GDRs) which are generally delayed 1-2 months. The velocity fields are published in the monthly NOAA Climate Diagnostics Bulletin and are particularly useful in monitoring the recent evolution of ENSO conditions. The pilot OSCAR web server allows user-selected geographic regions, display resolution and scaling of image display maps, as well as access to the entire Topex/Poseidon/Jason-derived field from 1993-present. NOAA/NESDIS National Oceanographic Partnerships Program (NOPP) A Processing System and Web-Server using Jason IGDR Data to Provide Timely Surface Velocity Fields in the Tropical Pacific Internet Access is Now Online The data are updated 3 times per month, within 10 days of satellite observations. The Data Display link will give you various options to plot surface current maps in any sub-area of the tropical Pacific between latitudes 35oN and 35oS. The most recent 10-day average data are displayed on the home page. A Dynamic Model1 uses Satellite Sea Level and Vector Wind Measurements to Compute Tropical Surface Currents on and off the Equator The web site is presently being developed and tested. We welcome your comments for improving the latest online version. Please try it out and tell us what you think. Monitoring the El Niño Southern Oscillation (ENSO) The July-September 2002 Data Indicate that the Present El Niño Flow is Intensifying Choose Display Options Vector or scalar options Date (1993-present) Enter Latitude/Longitude range Or Use mouse to select box Select spatial filter, color, scaling, and plot density Click “Generate Plot” Previous analysis shows that strong eastward current anomalies coincide with El Niño. (Anomalies are the difference between the monthly current and the seasonal mean.) The sequence from July through early September 2002 is shown with the current anomalies plotted on top of SST anomalies. The eastward flow has grown steadily stronger in the western half of the equatorial Pacific. (Vectors are horizontally smoothed to remove eddies). 1Bonjean, F., and G.S.E. Lagerloef, 2002: Diagnostic model and analysis of the surface currents in the tropical Pacific Ocean, Journal of Physical Oceanography, 32, 2938-2954.