Download
1 / 64
640 likes | 851 Views
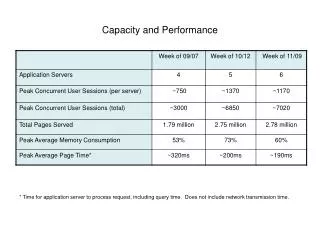
Performance and Capacity Considerations with VMware ESX 3.5- DRS and HA. Ellen Friedman Philadelphia CMG May 8, 2009. Agenda . Virtualization Candidate Consideration DRS and HA Overview Metrics: Performance/Capacity Capacity Planning and Performance Considerations.

E N D
Performance and Capacity Considerations with VMware ESX 3.5- DRS and HA Ellen Friedman Philadelphia CMG May 8, 2009
Agenda • Virtualization Candidate Consideration • DRS and HA Overview • Metrics: Performance/Capacity • Capacity Planning and Performance Considerations
Server ConsolidationA solution for Server “Sprawl” • Consolidation can lead to savings/efficiency and reduced TCO: • Hardware (not typically software- depends on licensing model) • IT resources and systems management costs • Power and Cooling and Floor Space • Add flexibility for future growth • Can facilitate on-demand resource provisioning depending upon the solution • Create an opportunity to provide HA and D/R at reduced cost • Create a single point of control
Server Consolidation Considerations • What Consolidation Ratio are you trying to achieve? E.g., 20:1, 40:1? • Need to mitigate risks: • Time to do back-ups • Start-up issues and possible outages • SAN is now the major point of contention and possible single point of failure depending upon implementation • Still not optimal even with ESX 3.5 for decision support or large database systems
Server Consolidation Considerations(cont’d) • Business and Application Considerations • Candidates for Consolidation and Virtualization • Similar Availability and SLA requirements • Solutions will be based on these • Understand the political landscape • Business/application should be able to work in a shared services environment • Minimal I/O resource requirements: • For virtualized environments- there is still some penalty for I/O and MPIO may not be achievable depending upon the solution
Capacity Planning and Balancing • What ROI does management expect? • What is the expected consolidation ratio? • Monitor as you roll out • Monitor resource usage for the HOSTS and the VMs • Compare Actual vs Projected resource usage. • Projected Resource Usage will come from Analysis of “List of Candidate Servers” • Projected CPU, Validate Memory, Validate I/O and Network • Develop Realistic Timeframes to provision additional hardware including cabling/network requirements. • Incorporate Tolerances to Accommodate for Delays • Ensure proper planning for Server (CPU, Memory, I/O, Network, Storage)
Capacity Planning and Balancing (cont’d) • Planning for the SAN • Understand the I/O performance capabilities Native vs. Virtualized • Utilize IOMETER to benchmark I/O performance by planning for your “profiles” e.g, amount and size of Sequential Reads/Writes vs Random Reads/Writes • IOMETER will produce I/O loading and response time reports for various types/sizes of I/O. • Need to plan for peak IOPs as well as storage Cache (kbytes/second) • Ability to Scale and Load Balancing for better performance • Ability to Re-size LUNs • E.g., 22 GB VM storage and LUN size of 400 GB (find the sweet spot here) • Number of VMs per LUN (12-15max) • Accommodate for growth in VM storage requirements • Accommodate for Snapshots, Swap Space (function of memory size) • Minimize impact of Test on Production
Virtualization Candidate Considerations and Creating Profiles • Create Templates for VM builds and profiles of the work. • Develop resource profiles for candidate applications in terms of CPU, I/O, Memory and Network • Collect the data for at least one peak week, but of course more is better! Sampling rate should be between 1-5 minutes (e.g., month end). • Summarize the data to obtain peak estimates per server (e.g., 95th percentile for CPU, I/O, NIC, memory) • Do the candidates have similar resource profiles as those of the systems you are considering? • Monitor resource usage over time to see if profiles change. • High I/O requirements may be problematic for virtualization • Summarize the data and “rank the candidates” perhaps limiting servers with high I/O demand and minimizing the number of servers with large memory footprints.
Virtualization Candidate Considerations and Creating Profiles (cont’d) • Availability and Service requirements • Will Dictate Back-up requirements and Disk/SAN/NAS Solutions to meet SLA • VMs with different SLAs and Availability requirements should not be placed in the same resource pool but perhaps not the same “cluster”? • Do all the Virtual Candidates fit the same model in terms of Storage requirements? Does the template work? • What are the differences in I/O Profiles?
What data to Measure in Windows-CPU • CPU Usage • Total CPU Usage: Percent busy and Normalized usage in SPEC-INTs not MHz (remember not all MHz are created equal) • How busy? Recommendation from VMware and to limit overhead/scheduling is 1 Virtual CPU per VM • This means you want to eliminate candidates which are projected to consume more than 1 Socket/Core on the consolidated platform. • How many VMs to deploy requiring multiple VCPUs? • How busy? • Depends upon your ROI and how many servers you need to consolidate and if CPU becomes a rate-limiting factor • Plan based on what can “fit” in your initial environment and size accordingly
What data to Measure in Windows Memory • Measuring Memory Consumption • Committed Bytes • Total Working Set Size • Available Memory • Page file utilization • Projected Memory Requirement: 1 GB, 2 GB, 3GB??? • Based on Committed bytes and Total Working Set • Data must be collected at more granular level since memory is an instantaneous counter • Need to account for memory requirements during normal processing and during back-ups • Allocate and round up based on “Templates” that you will create • How “Big can you go? How much can fit? • Depends upon ROI e.g., consolidation ratio and how much memory you “have” • You need to allocate what the system/server requires or else it will page or swap • Therefore typically < 4 GB • W
What data to Measure in Windows and from SAN for I/O Two Sides of the Coin • Side 1- SAN • What is the SAN Capacity how many IOPs can you achieve in total e.g., total throughput • Total Throughput specifically for VMware • Side 2- Windows requirements • Measure the IOPs and kbytes/second during peak timeframes. • For the candidate list, can the aggregate I/O throughput be met? • Do you need to eliminate “high I/O loads” • Example: If Capacity is 200 MB per second but you have a total requirement for 300 MB per second • then you would eliminate the highest I/O candidates which caused you to exceed your constraint for this phase.
I/O Pathing in ESX 3.0 • Multi-pathing Features • Two modes: Fixed/Preferred and MRU • MRU-Most recently used: Active/Passive devices • Devices that maintain a single active path to the disk and fail-over to the alternate path in the event of a component failure • Fixed/Preferred- Active/Active devices • Allows for manual balancing of LUNs between HBA’s. NOTE: I/O Pathing is supposedly improved in ESX 3.5
MRU Design Note: No I/O balancing Between HBA’s- Single Path I/O
Preferred Path Poor Man’s I/O Load Balancing Manually Load Balance to Improve performance
VMkernel A high-performance operating system that occupies the virtualization layer and manages most of the physical resources on the hardware, including memory, physical processors, storage, and networking controllers. The VMKernel Network and I/O goes through I/O queues within the virtualization layer Support for 10GigE cards is now available with ESX Server 3.5.
VMware and the “Virtual View”Managing Resources • Data centers • Virtual Center can view all of the resources and manage the resources of data centers. • Cluster • A group of hosts: In order to use HA and DRS feature, the hosts must be defined as part of a “cluster’ to provide for load balancing and fail-over between hosts. • Host • A container for virtual machines • Resource Pool • A collection of virtual machines on a host or within a cluster that possess the ability to have processor and memory resources controlled at an aggregated level.
What/Why Are Resource Pools? • Resource pools can be used to hierarchically partition available CPU and memory resources. • For each resource pool, you can specify reservation, limit, shares, and whether the reservation should be expandable. • The resource pool resources are then available to child resource pools and virtual machines. • Why? • Provides a “container view: Isolate and Protect different workloads in a “box”. (Critical vs non-Critical) • VMware DRS helps you balance resources across virtual machines.
Resource Allocation per VMCPU and Memory (not I/O) • Can guarantee resources with Reservations • Can “CAP” resource usage with Limits • Prioritization- Fair Share Scheduling • Specifying Shares: Apportionment Ratio • High- 4- • Medium-2: • Low-1 • Shares for CPU • High: 2000, Normal: 1000, Low: 500 • Shares for Memory • High: 20 Shares per MB of VM • Normal: 10 Shares per MB of VM memory • Low: 5 Shares per MB of memory
VMware ESX 3.5 Features • Storage VMotion: simplifies array migration and upgrade tasks and reduces I/O bottlenecks by moving virtual machines to the best available storage resource in your environment. • Provisioning across datacenters—VirtualCenter 2.5 allows you to provision virtual machines across datacenters. • Administrators can now clone a virtual machine on one datacenter to another datacenter. Templates can now be cloned between datacenters. You can also perform a cold migration of a virtual machine across datacenters. • SRM Site Recovery Manager • Support for 10GigE cards is now available http://pubs.vmware.com/vi3/wwhelp/wwhimpl/js/html/wwhelp.htm
VMware ESX 3.X Features • DRS – Allocates and balances computing capacity dynamically across collections of hardware resources for virtual machines • Policy can be created to determine migration thresholds • Automation level (Manual, Partially Automated, Fully Automated) • Manual/Partially Automated will display recommendations of candidates to “move” • Use Manual model to get started • Set custom levels (exclude specific VMs, set affinities) • VMware HA – Feature that provides easy-to-use, cost-effective high availability for applications running in virtual machines. In the event of server failure, affected virtual machines are automatically restarted on other production servers that have spare capacity. • VMware VMotion – Feature that enables the live migration of running virtual machines from one physical server to another with zero down time, continuous service availability, and complete transaction integrity
New With ESX 3.5 • Storage VMotion: simplifies array migration and upgrade tasks and reduces I/O bottlenecks by moving virtual machines to the best available storage resource in your environment. • you can move a Powered On VMware Guest virtual machine, from one ESX host AND from one ESX datastore (say one SAN to another or from one local host to a SAN) with no downtime • Provisioning across datacenters—VirtualCenter 2.5 allows you to provision virtual machines across datacenters. • As a result, VMware Infrastructure administrators can now clone a virtual machine on one datacenter to another datacenter. You can also clone a virtual machine on one datacenter to a template on another datacenter. Templates can now be cloned between datacenters. You can also perform a cold migration of a virtual machine across datacenters. • VMotion with local swap ESX 3.5 and VC 2.5 now provides for swap files to be stored on local storage and still provides VMotion. • Users can configure a swap datastore policy at the host or cluster level, although the policy can be overwritten by the virtual machine configuration. • During a VMotion migration or a failover for virtual machines with swap files on local storage, if local storage on destination is selected, the virtual machine swap file is recreated. • The creation time for the virtual machine swap file depends on local disk I/O (or if too many concurrent virtual machines are starting due to an ESX Server host failover with VMware HA).
VMware ESX 3.5 Features (cont’d) • VMware Site Recovery Manager • To Automate D/R recovery process • SRM guides users through the process of creating, automating, and testing disaster recovery plans for their virtual infrastructure. • SRM will require typically 30% more storage for Snapshots for testing your recovery plans and maybe more. • It works in conjunction with your SAN “mirroring” technology e.g., Clariion Mirror View. • VMware Update Manager • With Update Manager, you can automatically patch ESX hosts AND (get this) virtual guest machines! • It will also ensure that you don’t “boot” too many machines simultaneously which was something you previously needed to manually schedule
DRS Recommendations and Migration Threshold • DRS will automatically balance based on available “memory” and CPU resources within the Cluster. • Typically you will have a minimum of 4 hosts within a cluster and as many as 12- find your “sweet-spot”. • DRS Settings are on a scale of 1-5: • Level 5 is the most aggressive, while Level 1 makes the smallest number of migrations. • Concerns with “automatic” HA and DRS: • VMs and systems could end up in a “loop” using DRS if you aren’t conservative enough. • Can occur during scheduled “down windows” or back-ups which are more resource intensive • During these periods change DRS to be more conservative
DRS Migration levels • Examples of Migration Recommendations when in Manual or Partially Automatic Mode: • Balance Average CPU Loads • Balance Average Memory Loads • Satisfy Affinity Rule • Satisfy Anti-Affinity Rule
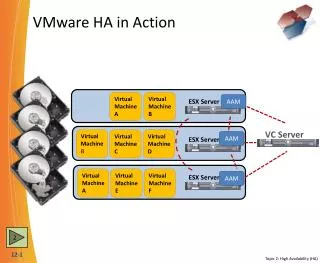
VMware Availability and HA • Detects server failures automatically, using a “heartbeat” on servers. • Monitors capacity continuously to ensure space is always available to restart virtual machines in the event of server failure. • Restarts virtual machines on a different physical server within the same resource pool. • If used in conjunction with VMware DRS it will “load balance” and choose the host on which to load the VMs.
Considerations for HA CPU Balancing in a “failure” Processor Utilization • HA will prevent you from “booting up a VM” if sufficient resources aren’t available to support it under “fail-over” • Specify the number of “Hosts configured failover capacity for the cluster” • Overall individual host CPU usage should not exceed 60% so that there is sufficient capacity to take on “work from another host” in the event of a failure. • Example: Fail-over capacity =1 and 6 Hosts with 120 VMs • Need sufficient capacity CPU capacity to host 4 VMs on remaining 5 hosts. • If CPU > 80%, overall VM performance will degrade due to CPU queuing. • Increase in high % Ready times. • % CPU Ready time (indication of queuing) shouldn’t exceed 5% consistently, or 1000ms over the default 20 second sampling interval. Anything more could indicate serious CPU contention issues.
HA Capacity ConsiderationsMemory • Memory requirements must be satisfied for all “reservations” + Overhead for each VM to be powered on. • HA memory requirements would need to be satisfied on the host with smallest memory configuration. • Memory overhead for each VM:
DRS and HA Considerations when the Cluster is constrained • Re-start Priority • Indicates relative priority for re-starting virtual machine in case of host failure • Highest priority VMs will start first • If sufficient resources aren’t available then lower priority VMs won’t start-up • Re-start priority is especially important if there isn’t sufficient capacity • Example: You have turned off “admission control” which allows you to operate when HA rules are violated but you have more VMs then there is capacity for • Example: Failure capacity is set to 1 but there are 2 hosts which have failed and not sufficient capacity.
CPU Metrics • CPU Usage (%) – This is cumulative % used across all CPUs in the host. • CPU Usage in MHz– This counter identifies the total CPU usage in MHz used on • This counter is useful for normalizing % CPU for capacity planning when there are hosts with differing CPU speeds or core counts in the same cluster. • % Ready (in ESXTOP, per VM) – This identifies the amount of time a VM is ready to run, but cannot because VMkernel is unable to schedule the VM process on a physical CPU. High % Ready typically means there is CPU contention on the ESX host. • CPU Ready (in Virtual Center per VM) – This counter reflects the same information as % Ready in ESXTOP; • Virtual Center reflects this measurement in milliseconds. The VI Client can view virtual machines CPU ready time in real-time, but historical tracking requires the Virtual Center logging level to be set to 3. • Calculating % Ready from CPU Ready in Virtual Center • The CPU Ready value in Virtual Center is displayed in milliseconds and is refreshed every 20 seconds. • CPU Ready time of 280ms over the default refresh interval (20000ms) • %Ready=(280/20000) * 100 = 1.4%
%CPU Ready =4.942/20 sec =25% High % CPU Ready for VM
Memory Management • 3 mechanisms are utilized for memory management to expand/contract amount of memory used by VMs • Transparent Page Sharing • Redundant virtual machine memory pages are "shared“ • The Vmkernel removes duplicate pages from physical RAM and the page table is adjusted to redirect the virtual machine's virtual page back to the page in RAM. This eliminates redundant pages in physical memory • Swapping • Used to forcibly reclaim memory (ESX decides not Guest) • Ballooning • VMmemctl module loaded into the guest operating system. • Guest OS determines what to pages/swap out • Part of VMware tools, guest OS must be configured with sufficient swap space.
Memory • Memory Granted – this is the amount of memory that the vmkernel has allocated to all virtual machines running on the server. • This represents a rough estimate of how much RAM will be needed for another host to spin up the VMs. • Memory Usage % - This metric identifies the memory used on the host as a percentage, based on Memory Consumed divided by the total memory in the ESX host. • Memory Consumed – How much memory is actually being used by the VMs. • This takes into account transparent page sharing, zero pages, vmkernel and service console memory usage, and virtualization overhead. • Memory Balloon – This counter should be zero under normal circumstances. Otherwise, it indicates the system is under memory constraints and has begun borrowing memory from virtual machines to meet demands. • Memory Swap Used – This counter should always be zero. Memory swapping is used as a last resort, so if swapping currently exists on the host it means memory is severely overcommitted. • Memory Zero – The amount of memory that is not being used by the allocation • This metric can be helpful in identifying VMs that may have been configured for more RAM than necessary
Shared=1GB • Granted=24 GB • Active=3.5 GB • Ovhd=2 GB • Swap=0 • Zero=830 MB Memory Usage Displayed from VC
Disk Usage Metrics • Disk Usage (KBps) – This number is cumulative across all HBAs in the host. • VMFS Volume Free Space – This is monitored by querying either an ESX host that has access to the VMFS, or by querying the Virtual Center database. The former will provide the most up to date information. • SAN Performance Data • Response time per LUN (read time, write time), LUN queue length, read vs write activity, IOPs per LUN
What Data to Look at if you have a problem? Processor: • Presentation by ESX provides the “true utilization view” • % CPU Ready indicates if the VM is “under-configured” due to high CPU waits. • However, within a VM’s view, you can also look at CPU usage to determine if the “shares” were under-allocated/over-allocated. • CPU usage for host is exceeding levels-DRS will re-balance for you • So no need to balance VMs across other hosts • Monitor resource usage over time to observe trends for the host and for each of the VMs. • Monitor CPU usage to “profile workloads” and try to consider a view of “large” , “medium” and “small”. • Identify if the “large consumers” and determine if “tuning” is required. • Did you plan for these “large consumers” in your ROI projection? • Ensure there is sufficient capacity for a “fail-over” HA scenario
VM CPU Usage(max=100%) CPU Usage near 100%
CPU Usage on 5-6 CPU Usage near 100%
%CPU Ready DEV 35 SIT Compute %CPU Ready= CPU Read time (ms)/20,000*100 should be <5%: 2500/20,00>12%
Determining Processor Resource Requirements • MHz or SPEC-INTs vs CPU busy: • VMware reports MHz used is a “normalized” metric and is used to determine capacity requirements. • SPEC-Ints would be a better mechanism • E.g. Total capacity is 2.6 GHz*number of CPUs • Each VM is consuming approximately 200 MHz • How many VMs can you support on 2-dual core 2.6 GHz processors? • Need to understand overhead • As you add VMs, you also add overhead.
CPU Usage as VMs are Added • 6 VMs were added on 10-14 • 8 VMs were added on 10-21 • CPU usage increased from 8% to 20% • Minimal Overhead as we increased from 8 to 14 VMs per host • CPU MHz per VM at 6 VMs=143.8 MHz • CPU MHz per VM at 14 VMs=153.8 MHz • What is CPU requirement per VM at 20 VMs or 30 VMs? • Non-linear increase in overhead. Need to benchmark it.
CPU Usage as VMs are Added 14 VMs 6 VMs
Benchmarking and Loading your environment • HOW? • Slowly load up one host with a mix of workloads- Large, Medium, Small and measure the resource consumption and overhead as you load. • Look for a measure of “user experience”- ETE R/T • SQL: SQL R/T, Web servers: Page Load times, other ETE • Measure CPU usage, and overhead as you load • Measure the memory consumption • Measure I/O throughput and I/O response time as the load increases. (Use data from SAN tools) • Remember don’t have true “MPIO”
Monitor CPU usage per VM • Monitor Usage by VM by time of day • Trend CPU usage by VM across time • (do not do this for test systems)
Monitor I/O Over Time and by VM I/O Usage (past Day) Total for Host
CPU Capacity • Monitor Physical CPU usage and %Ready for all VMs • If %Ready >5% and starts to approach 10% delay the host is “saturated”. It doesn’t have to be running at 100% physical utilization. • Monitor usage of VMkernel • Monitor System Services (only dispatchable on CPU 0)
VMware Distributed Resource Scheduler (DRS) and CPU saturation • Verify that all systems in the DRS cluster are carrying load when the server you are interested in is overloaded. • Change the “aggressiveness” of the DRS algorithm. • Review “VM reservations” for CPU and Memory against other hosts in the cluster to ensure that virtual machines can migrate (e.g., sufficient capacity available after “reservations” are satisfied). • Increase the number of Hosts (servers) in the DRS cluster so virtual machines from the server you are evaluating can migrate to servers with available resources. • Or, reduce the number of VMs in the Cluster and move them to a different Cluster.