
Uploaded by
gamada
4 SLIDES
316 VIEWS
40LIKES
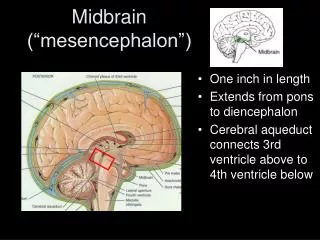
Midbrain Hemorrhage
DESCRIPTION
926-1. Midbrain Hemorrhage. Figure 1. Axial T2WI shows a high signal intensity lesion in the right dorsal midbrain immediately adjacent to the cerebral aqueduct. Figure 2. Axial GRE (T2*) scan shows the lesion “blooms” and contains blood degradation products.
Download

1 / 4
Download Presentation 
Midbrain Hemorrhage
An Image/Link below is provided (as is) to download presentation
Download Policy: Content on the Website is provided to you AS IS for your information and personal use and may not be sold / licensed / shared on other websites without getting consent from its author.
Content is provided to you AS IS for your information and personal use only.
Download presentation by click this link.
While downloading, if for some reason you are not able to download a presentation, the publisher may have deleted the file from their server.
During download, if you can't get a presentation, the file might be deleted by the publisher.
E N D
Presentation Transcript
926-1 Midbrain Hemorrhage
Figure 1. Axial T2WI shows a high signal intensity lesion in the right dorsal midbrain immediately adjacent to the cerebral aqueduct
Figure 2. Axial GRE (T2*) scan shows the lesion “blooms” and contains blood degradation products


More Related