Download
1 / 33
360 likes | 675 Views
Characterization of Avalanche Photodiode Response Under Optical and Thermal Conditions. Victoria Kaiser Rutgers University and Princeton Lightwave Inc. Table of Contents. 3. 6. 10. 23. 32. 4. Abstract. Incident Optical Power Beam Width Characterization.

E N D
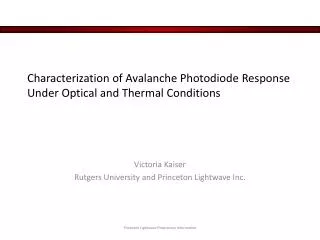
Characterization of Avalanche Photodiode Response Under Optical and Thermal Conditions Victoria Kaiser Rutgers University and Princeton Lightwave Inc.
Table of Contents 3 6 10 23 32 4 Abstract Incident Optical Power Beam Width Characterization APD Response to Optical Stress Causing Catastrophic Damage APD Response to Increasing Operating Temperature Summary APD Background
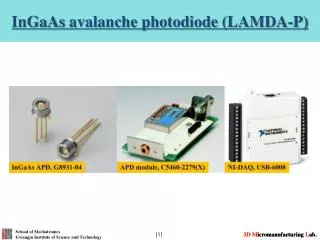
Abstract Experiments were performed to collect customer-requested information on the performance of InGaAs APDs (avalanche photodiodes) under stressful conditions. Data of interest included the amount and type of 1550-nm applied optical power the devices (200 and 80-µm detector diameter) could withstand before suffering catastrophic damage. Devices were subjected to both CW and pulsed optical power of different amplitudes and pulse repetition rates. Data of interest also included the effects of operating temperature on APD performance. System heating effects spanning from the introduction of noise, to compensation for maintaining responsivity are explored.
APD Background Thermal • A high voltage bias generates a high electric field across the multiplication region of the semiconductor. • The electric field causes impact ionization from the photogenerated electrons, thus generating an avalanche of electrons. • The electric signal can be collected at the output of the APD. Avalanche photodiodes (APDs) are PiN diodes with gain. Courtesy: Perkin Elmer Avalanche Photodiode Users Guide
APD Background • APDs are used in a variety of applications including rangefinding, 2D and 3D imaging, spectroscopy and optical communication receivers. • Typically, APDs are operated in the linear mode (Vbias < Vbreakdown) and are used to detect and resolve optical pulses. • APDs operating in the Geiger mode(Vbias > Vbreakdown) are capable of detecting single photons. • The following experiments designed to characterize APD behavior under non-ideal temperature, and optical power conditions are performed with the APDs operating in the linear mode.
Characterization of Fiber Focuser:Beam Width with Respect to Distance from Barrel and Percent Power Incident on Detector
Beam Waist Measurement • In order to qualify the results of the experiments, the (single-mode) laser beam collimator was characterized to determine beam width and intensity relative to distance. • The blade was drawn along evenly spaced planes separating the photodetector andthe barrel of the fiber focuser in 10-µmincremements. • The photocurrent (intensity) was recorded at each interval.
Beam Waist Measurement • Assuming the light follows a normal Gaussian distribution for λ = 1550-nm, beam width was selected to be the width of the illumination between the 1/e points of the plotted intensity. • These widths are used in the equation above to calculate the beam width for any distance from the barrel of the fiber focuser.
Beam Waist Measurement • The measured beam width with respect to position measurements (right) are expected to follow the form related to the equation (left). • Thus the beam waist (maximum intensity) is 20-μm and is located approximately 1-mm from the barrel of the collimator. • This plot will be used to verify intensity of the incident light, and the optical fill of the beam on the detector (beam width).
Optical Stress Experiment • The incident optical power limitations, and time-to-failure of APDs under nominal operating conditions are important criteria for proper system design and fault analysis. • 200um and 80um detectors exposed to CW and pulsed optical power. under constant current monitoring to capture the damage event. • APD load: 1-Ω • APD bias is set such that R = 9-A/W • Optical power supplied to APD via fiber-focuser, and is adjusted via optical attenuator • Current meter output is constantly recorded for the duration of the test via PC
Optical Stress Damage • The APDs were measured to characterize their dark current with respect to bias voltage for comparison purposes. Devices used were confirmed to have normal, representative responses • The APD was expected to indicate “damage” by a sudden jump in current, a sudden and drastic decrease in breakdown voltage, and/or an increase in dark current approaching the photocurrent. This damage would indicate the maximum power (percent power based on beam distance from APD) and duration of power under nominal operating conditions that the APD can withstand before failing.
Electric Current • In order to ascertain a baseline for APD damage, 200-µm APDs were tested to determine the required electrical power to break the APDs in ambient light. • The goal was to ascertain any correlation between devices with regard to electrical failure. • Device #1 was used to establish baselines values for damage. Device #2 was used to narrow the range of supplied current required for damage.
Electric Current – 200µm • In both cases the device break just under approximately 0.55-W of power (just over 6-mA of current).
CW Optical Power – 200µm • 200 and 80-µm APDs were aligned and exposed to CW optical power of increasing intensity for a set exposure time until the device was damaged.
Pulsed Optical Power Pulsed Optical Power Experiments Designed: • Increased repetition rate (CW) spends less time in the pulse off stage • The device should heat faster and therefore break at lower Popt. • Constant repetition rate and increased optical power compare to CW optical power. • Required optical power to break is expected to increase. • Constant optical power and increased pulse repetition rate. • Constant pulse energy - APD damage due to heating should show decreased failure times as pulse frequency increases.
Pulsed Optical Power – 200µm • Required peak pulsed optical power was slightly larger than required CW optical power to break. • Exposure time to break for pulsed optical power was significantly longer than CW experiment.
Pulsed Optical Power – 200µm • Average optical power was changed via frequency so pulse energy (2-nJ) was maintained throughout the test. • The device failed after 355-seconds (6-minutes) of exposure to the 5-MHz pulse of 20-mW peak optical power (10-mW average optical power).
CW Optical Power – 200µm • The previous devices were not thermally controlled. The following devices were tested in a custom fit TO-8 package copper heat sink block paired with a straight-fin aluminum heat sink. • The device failed instantly under 11-mW of optical power, which corresponds to an output photocurrent of 11.5mA.
Heating Effects – 200µm • Responsivity and photocurrent are slightly improved of the 200-μm device seated in the heatsink. 2-mW, 1.5-mA 6-mW, 8-mA 2-mW, 1.9-mA 6-mW, 6-mA 200-μm APD exposure to CW optical power – heatsink 200-μm APD exposure to CW optical power – no heatsink
Optical Stress Summary – 200µm • A total of 7 200-μm devices were tested under the conditions outlined in the table. • The variability in failures regarding optical power is potentially due to variability in the saturation, though this has not been directly tested/measured.
Optical Stress Summary – 80µm • The 80-μm devices without the heatsinks failed under approximately half the photocurrent of the 200-μm devices. • The 80-μm devices tested with heatsinks failed under approximately ¾ the photocurrent as the 200-μm device tested with the same heatsink. • Experiments are still in progress to gather data from applying pulsed optical power to ascertain a correlation between device sizes.
Thermal Response • The APD was inserted into a specifically-machined copper arm, and the armature mounted on a manually calibrated hot plate. • DUT IV curves were measured in the dark, and under illumination for temperatures ranging between 85C and 25C in incremental steps of approximately 10C.
Pre-Exposure LIV Curve • Pre-exposure LIV curve for the device under test at room temperature. • Measured breakdown voltage = 62.3V.
Thermal Response - Photocurrent • Change in photocurrent response to bias voltage with respect to operating temperature ranges from approximately 5-uA to 20-uA due to temperature at Vbias ≈ 62V.
Thermal Response – Dark Current • Change in dark current, or shot noise response to bias voltage with respect to operating temperature ranges from approximately 0.4-uA to 1.5-uA due to temperature at Vbias ≈ 62V.
Dark Current Components • Bulk leakage (current through multiplier region) and perimeter leakage (current circumventing multiplier region) are extracted from measured dark current. • Extraction method is sufficiently accurate to estimate dark current and noise within an order of magnitude. APD Structure
Calculated Output Noise Density • The total noise is the sum of the perimeter and bulk leakage noise. • The perimeter leakage is shot noise and not subject to APD excess noise • The bulk leakage is subject to APD excess noise factor, i.e. F=M0.7
APD Sensitivity • The sensitivity of the APD is calculated as an input optical signal which produces a signal equal to the dark noise • i.e. NEP is the output noise density normalized by APD responsivity
Temperature Compensation • Presuming responsivity of the device is the parameter to maintain, the following is the required bias voltage compensation based on the two 200-μm samples tested.
Summary Both the internal, and operating temperatures of the InGaAs APDs are critical contributions to the definition of device performance. • Maximum limits for optical power incident on the detector are used both in the specification sheet, as well as in the ongoing analysis towards general device failure criteria. • Increasing the operating temperature affects output current, and consequently shot noise of the APD according to the equation • Each increase in degree C relates to 0.1-V increase in bias voltage to maintain device responsivity, and approximately 1-fW/√Hz noise equivalent power.