Data Flow Diagrams (DFDs)
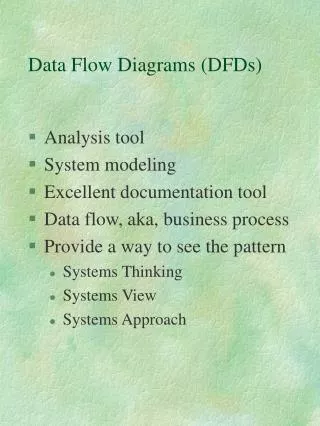
Data Flow Diagrams (DFDs). Data Flow Diagrams (DFDs). Data flow diagram (DFD) is a picture of the movement of data between external entities and the processes and data stores within a system DFDs are an excellent illustration of modeling as the bridge between specification and implementation.

Data Flow Diagrams (DFDs)
E N D
Presentation Transcript
Data Flow Diagrams (DFDs) Data flow diagram (DFD) is a picture of the movement of data between external entities and the processes and data stores within a system DFDs are an excellent illustration of modeling as the bridge between specification and implementation.
DFD Symbols Process DataFlow DataStore Source/Sink (External Entity)
Process Work or actions performed on data (inside the system) Labels should be verb phrases Receives input data and produces output
Rule 1: Process Can have more than one outgoing data flow or more than one incoming data flow
Rule 2: Process Can connect to any other symbol (including another process symbol)
Data Flow Is a path for data to move from one part of the IS to another Arrows depicting movement of data Can represent flow between process and data store by two separate arrows
Data Store Is used in a DFD to represent data that the system stores Labels should be noun phrases
Rule: Data Store Must have at least one incoming and one outgoing data flow
Source/Sink (External Entity) External entity that is origin or destination of data (outside the system) Is the singular form of a department, outside organization, other IS, or person Labels should be noun phrases • Source – Entity that supplies data to the system • Sink – Entity that receives data from the system
Rule: Source/Sink Must be connected to a process by a data flow
Rules for Using DFD Symbols Data Flow That Connects YES NO
Context Diagram Top-level view of IS Shows the system boundaries, external entities that interact with the system, and major information flows between entities and the system. Example: Order system that a company uses to enter orders and apply payments against a customer’s balance Level Of Details
Developing DFDs: AnExample • Hoosier Burger’s automated food • ordering system • Context Diagram (Figure 8-4) contains no data stores • Next step is to expand the context • diagram to show the breakdown of • processes (Figure 8-5)
Figure 8-4Context diagram of Hoosier Burger’sfood ordering system
Level-0 DFD Shows the system’s major processes, data flows, and data stores at a high level of abstraction When the Context Diagram is expanded into DFD level-0, all the connections that flow into and out of process 0 needs to be retained.
Figure 8-5 Level-0 DFD of Hoosier Burger’s food ordering system
Context Diagram of Order System • Order system that a company uses to enter orders and apply payments against a customer’s balance
Level-0 DFD of Order System • Order system that a company uses to enter orders and apply payments against a customer’s balance
Lower-Level Diagrams Functional Decomposition An iterative process of breaking a system description down into finer and finer detail Uses a series of increasingly detailed DFDs to describe an IS Balancing The conservation of inputs and outputs to a data flow process when that process is decomposed to a lower level Ensures that the input and output data flows of the parent DFD are maintained on the child DFD
Strategies for Developing DFDs Top-down strategy Create the high-level diagrams (Context Diagram), then low-level diagrams (Level-0 diagram), and so on Bottom-up strategy Create the low-level diagrams, then higher-level diagrams
Data Flow Diagram Errors • The following conditions are errors that occur when drawing a data flow diagram: • A process with only input data flow or only output data flow from it.
Data Flow Diagram Errors (Continued) • Data stores or external entities are connected directly to each other, in any combination.
Data Flow Diagram Errors (Continued) • Incorrectly labeling data flow or objects • Examples are: • Labels omitted from data flow or objects. • Data flow labeled with a verb. • Processes labeled with a noun. • Too many processes on a data flow diagram. • Nine is the suggested maximum.
Data Flow Diagram Errors (Continued) • Omitting data flow from the diagram • Unbalanced decomposition between a parent process and a child diagram • The data flow in and out of a parent process must be present on the child diagram.
Current Physical • There are two types of DFDs Physical and Logical DFDs • In the early stages you'll build a current physical DFD. On these you'll be recording, warts and all, the ways things are presently (often known as the "As-is"). • It will have all sorts of un-logical things to show and will reflect how things are done currently. There will likely be processes that exist purely because things are done manually. Data stores (such as stick pins or copy orders file etc.) will exists because of how things are presently done.
Current Physical • shown as External Entities. • Clerical and temporary data stores will likely feature heavily • What you document on the DFD won't seem to be very logical(I've even found processes that aren't actually needed, but still are done because no one told the staff they were no longer needed!). • Dataflow names will likely correspond to document names • There are sure to be process to process flows • Data flows between external entities will possibly feature
Logical Data Flow Diagrams • Logical data flow diagrams show how the business operates. • They have processes that would exist regardless of the type of system implemented. • In the current logical DFD variant, you start with the current physical and remove all aspects that are to do with "how" things are done presently - you need to be showing only the "what" aspects.
Data Flow Diagram Progression The progression of creating data flow diagrams is: • Create current physical DFD • Create a logical DFD of the current system. • Next add all the data and processes not in the current system that must be present in the new system. • Finally derive the physical data flow diagram for the new system.
Logical Data Flow Diagrams Advantages Advantages of logical DFDs are: • Better communication with users. • More stable systems, since the design is based on a business framework. • Increased understanding of the business by analysts. • The system will have increased flexibility and be easier to maintain. • Elimination of redundancy.
Physical Data Flow Diagrams Physical data flow diagrams show how the system operates or how the new system will be implemented. • Physical data flow diagrams include: • Clarifying which processes are manual and which are automated. • Describing processes in greater detail. • Sequencing processes in the order they must be executed.
Physical Data Flow Diagrams Physical data flow diagrams include (continued): • Temporary data stores and transaction files. • Specifying actual document and file names. • Controls to ensure accuracy and completeness.
Physical Data Flow Diagrams Advantages • Clarifying which processes are manual and which are automated • Describing processes in more detail than logical DFDs • Sequencing processes that have to be done in a particular order • Identifying temporary data stores
Physical and Logical Data Flow Diagrams • WHAT the system does- Current Physical DFD • HOW it does it- Current Logical DFD • WHAT it should do- Required Logical DFD • HOW it should do it- Required Physical DFD
Guidelines for Drawing DFDs • Completeness DFD must include all components necessary for systemEach component must be fully described in the project dictionary or CASE repository. • Consistency The extent to which information contained on one level of a set of nested DFDs is also included on other levels
Exercise: Precision Tools sells a line of high-quality woodworking tools. When customers place orders on the company’s Web site, the system checks to see if the items are in stock, issues a status message to the customer, and generates a shipping order to the warehouse, which fills the order. When the order is shipped, the customer is billed. The system also produces various reports. Draw a context diagram for the order system Draw DFD diagram 0 for the order system
Identify Entities,Process,Data Stores & Data Flow Entities Customer Warehouse Accounting Processes 1.0 Check Status 2.0 Issue Status Messages 3.0 Generate Shipping Order 4.0 Manage Accounts Receivable 5.0 Produce Reports Data Stores D1 Pending Orders D2 Accounts Receivable • Data Flows • Order • In-Stock Request • Order Data • Status Data • Status Message • Shipping Order • Order Data • Invoice • Shipping Confirmation • Payment • Accounting Data • Accounts Receivable Data • Order Data • Inventory Reports 1.0 2.0 3.0 4.0 5.0