Download

1 / 41
410 likes | 566 Views
Hatching failure and population bottlenecks. A resource provided by Science Outreach at the University of Canterbury. www.outreach,canterbury.ac.nz. Population bottlenecks in birds and hatching failure . Based on the following study:

E N D
Hatching failure and population bottlenecks A resource provided by Science Outreach at the University of Canterbury www.outreach,canterbury.ac.nz
Based on the following study: Hatching failure increases with severity of population bottlenecks in birds. by James V. Briskie and Myles Mackintosh
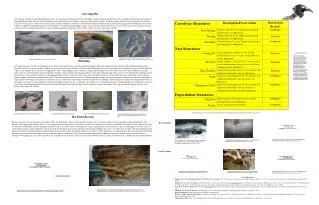
Habitat destruction, exploitation and introduction of exotic predators are causing populations of birds to decrease in number. One of the unspoilt regions of New Zealand in the Chatham Islands (Rangatira Island)
New Zealand Black Robin (found only in the Chatham Islands)
Before the 1870’s there was a diverse Black Robin population.....
Before the 1870’s there was a diverse Black Robin population.....
The introduction of rats and cats to New Zealand reduced the population of Black Robins to only a few individuals
The introduction of rats and cats to New Zealand reduced the population of Black Robins to only a few individuals – this is a genetic bottleneck
...when the population later recovered, due to conservation efforts, the genetic diversity is reduced.
...when the population later recovered, due to conservation efforts, the genetic diversity is reduced.
As a population decreases in size, a lot of genetic diversity is lost.
As a population decreases in size, a lot of genetic diversity is lost. time
As a population decreases in size, a lot of genetic diversity is lost. this is a genetic bottleneck time
As a population decreases in size, a lot of genetic diversity is lost. time ..when the population recovers, the population is not as genetically diverse as the original population.
The smaller the size of the genetic bottleneck the more in-breeding occurs, and there is even less genetic diversity in the new population.
The smaller the size of the genetic bottleneck the more in-breeding occurs, and there is even less genetic diversity in the new population. time
When a group of birds is relocated far from its source population,
When a group of birds is relocated far from its source population, it is similar to a genetic bottleneck.
When a group of birds is relocated far from its source population, it is similar to a genetic bottleneck. The founder population is not as genetically diverse as the source population.
SOURCE population When the new population recovers in the new area it is not as genetically diverse as the source population.
Lower genetic diversity in a population may result in fitness costs and decrease population survival. Scientists check the fitness of Black Robins on Rangatira Island
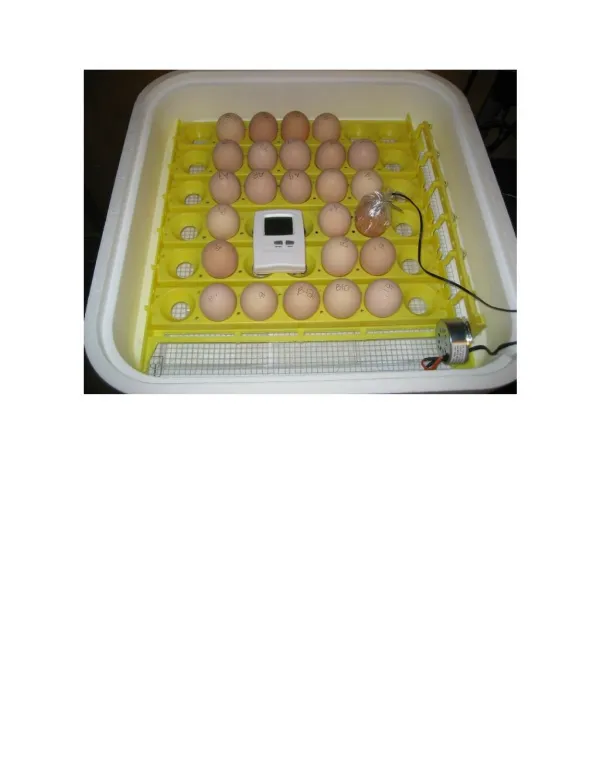
A group of birds, like the Kakapo, are relocated to a predator-free NZ island to increase the numbers of these endangered birds.
A group of birds, like the Kakapo, are relocated to a predator-free NZ island to increase the numbers of these endangered birds.Only about half the eggs that survive incubation successfully hatch.
...similar problems have been observed in the Black Robin (the population was reduced to one breeding pair). The Black Robin population is now over 200. Successfully hatched Black Robin chicks
To investigate the effect of genetic bottleneck size on hatching failure in birds, data was collected from a variety of sources and treated with statistics and log transformed.
figure 1 Native New Zealand birds Increase in hatching failure with increasing severity of population bottleneck in22 NativeNew Zealand birds. Open circle shows mean hatching failure in 15 species that did not pass through a bottleneck.
figure 1 Native New Zealand birds Increase in hatching failure with increasing severity of population bottleneck in 22 NativeNew Zealand birds. Open circle shows mean hatching failure in 15 species that did not pass through a bottleneck. Hatching failure increased when bottlenecks dropped below 150 individuals.
figure 2 Bird species introduced to NZ Increase in hatching failure of 15 introduced species with decreased numbers of individuals released by the 19th century New Zealand acclimatization societies. Open circle shows mean hatching failure in the same species in their native range.
figure 3 Bird species introduced to NZ Increase in differences in rate of hatching failure between each introduced population in New Zealand (postbottleneck) and their source (prebottleneck) for 15 species of introduced birds with data in both localities. Positive values indicate that hatching failure is greater in the introduced populations.
The smaller bottleneck size caused more hatching failure compared to the source population in their native habitat Positive values indicate that hatching failure is greater in the introduced populations.
Read the information on the worksheet, study the graphs and answer the questions.
1. Explain how the “bottleneck” occurred in the Black Robin population of New Zealand. 2. Explain the trend shown in figures 1 and 2. 3. Explain the trend shown in figure 3. 4. Why would this study be useful to conservationists in New Zealand and worldwide?
Acknowledgements University of Canterbury Science Outreach and School of Biological Sciences. Kakapo photo by :Markus Nolf This resource was made possible through funding from the Canterbury Community Trust and the Brian Mason Scientific and Technical Trust