Download
1 / 28
280 likes | 403 Views
Hierarchical Features of Large-scale Cortical connectivity. Presented By Surya Prakash Singh. Authors. Luciano da F. Costa Head of the Multidisciplinary Computing Group and Cybernetic Vision Research Group (IFSC-USP) Olaf Sporns Department of Psychology, Indiana University

E N D
Hierarchical Features of Large-scale Cortical connectivity Presented By Surya Prakash Singh
Authors • Luciano da F. Costa Head of the Multidisciplinary Computing Group and Cybernetic Vision Research Group (IFSC-USP) • Olaf Sporns Department of Psychology, Indiana University Bloomington, USA
Introduction • In this paper they discribe a novel analysis of the large-scale connectivity between regions of the mammalian cerebral cortex, utilizing a set of hierarchical measurements proposed recently • They examine previously identified functional clusters of brain regions in macaque visual cortex and cat cortex and find significant differences between such clusters in terms of several hierarchical measures
contd... • The mammalian cerebral cortex is one of the most complex system found in nature, because it forms an intricate pattern of connection between individual neurons • A large amount of data becomes available, it is interesting to analyze and model organizational and functional properties of mammalian cortical structure
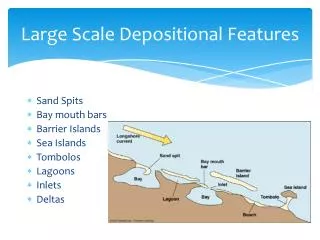
Analysis of complex network • Connectivity of a complex can be characterised in terms of several topological measurements : • Node Degree • Clustering cofficient • shortest path between two nodes
Hierarchical Approach • The nodes which are accessible through a single link from the reference node will constitute the first hierarchical level • The nodes reachable by a minimum path of two edges from the reference node will define the second hierarchical level, and so on
Contd… • The node degree at ith hierarchical level will be the number of links between the nodes at the i-1th and ith hierarchical levels. For example in fig-1 degree of node (5) at 1st level is 5 and at second level is 6
Hierarchical measurements • Given a specific node i, the set of nodes which are exactly at shortest distance d from i is called the ring of radius d centered at “node i” • And it is expressed as Rd (i). • Figure 1 illustrates a simple network with N =10 nodes and K = 15 edges and the rings of radius d = 1 and 2 centered at node i = 5.
Contd… • Hierarchical neighbors at distance d from a node i will be represented as nd (i), is the number of nodes contained in Rd(i) n1 (5) = 5 and n2 (5) = 4. • Sum of all hierarchical neighbors over all hierarchical depths must be equal to N − 1
Contd… • The hierarchical degree of a node i is the number of edges extending from the ring of radius d centered at i to the nodes belonging to the ring of radius d+1 centered at that same node. Example hierarchical degrees of node 5 in Figure 1 are h0 (5) = 5, h1 (5) = 6 and h2 (5) = 0
Divergence Measurement • Divergence Measurement defined as: because the number of hierarchical neighbors and the hierarchical degree are often correlated, they are usually not identical
contd… For example in previous figure D1 (5) = n2 (5) /h1 (5) = 4/6 = 2/3, indicating that there are more edges converging than diverging from ring 1 to ring 2. • Also we can say that 0 ≤ Dd (i) ≤ 1
Hierarchical clustering coefficient • hierarchical clustering coefficient at distance d is defined as the ratio between the number of existing edges in Rd (i) and the maximum possible number of edges between the nodes in that ring, i.e. • where ed (i) stands for the number of edges inside the ring Rd (i).
The hierarchical clustering coefficient CC1(5) will be CC1(5) = 7/(5*4) = 7/20 • Hierarchical clustering coefficient provides the information of connectivity between the nodes at successive distances from the reference node.
Author approach • In this paper author uses algorithm, written in SCILAB (www.scilab.org), which first identifies the distances from each reference node to all other nodes and then uses this information in order to calculate the hierarchical degree, divergence ratio and hierarchical clustering coefficient
Contd… • In this paper author examined two large-scale cortical connection matrices, for macaque visual cortex (N = 30, K = 311) and cat cortex (N = 52, K = 820). • This data is divided into two functionally distinct clusters, defined by similarities and dissimilarities in their interconnectivity:
Contd… • a parietal and occipito-parietal cluster (V1, V2, P, V3A, MT, V4t, V4, PIP, LIP,VIP, DP, PO, MSTi, MSTd, FST, FEF) and an inferior-temporal and prefrontal cluster (PITv, PITd, CITv, CITd, AITv, AITd, STPa, 7a, TF, TH, VOT). We refer to these two clusters as “dorsal” and “ventral” respectively.
Macaque visual cortex • The hierarchical depth of all regions is limited to 3, represented by the successive rings, and the gray-level scales are normalized between black (minimum value) and white (maximum value) for each type of hierarchical measure, respectively
Contd… dorsal cluster
Contd… ventral cluster
Cat cortex • They performed hierarchical measures analyses on the connectivity matrix of cat cortical regions, by statistically comparing areas in anterior and posterior clusters
Contd… Posterior cluster
Contd… anterior cluster
Results • They show that the ventral stream consists of areas that are more tightly clustered at hierarchical depths greater than 1, when compared to areas of the dorsal stream. Hence less divergence
Contd… • They show that clusters of sensory areas are less divergent while regions of the frontolimbic complex, containing many polysensory and multimodal neurons, are more divergent and less highly clustered at depths greater than 1 • The major application of hierarchical measures, highlighted in this paper, is in identifying principles of structural network organization
Future work • There are many future applications of hierarchical measures, including the study of additional large-scale connection matrices such as the one of whole macaque cortex or cat cortex or of the human cortex, when such data become available in the future