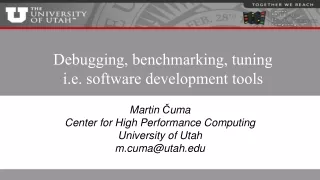
Debugging and Optimization Tools
Debugging and Optimization Tools. Richard Gerber NERSC User Services David Skinner NERSC Outreach, Software & Programming Group UCB CS267 February 15, 2011. Outline. Introduction Debugging Performance / Optimization. See slides and videos from NERSC Hopper Training


Debugging and Optimization Tools
E N D
Presentation Transcript
Debugging and Optimization Tools Richard Gerber NERSC User Services David Skinner NERSC Outreach, Software & Programming Group UCB CS267 February 15, 2011
Outline • Introduction • Debugging • Performance / Optimization See slides and videos from NERSC Hopper Training • http://newweb.nersc.gov/for-users/training-and-tutorials/courses/CS267/ • (newweb -> www sometime soon)
Introduction • Scope of Today’s Talks • Debugging and optimization tools (R. Gerber) • Some basic strategies for parallel performance (D. Skinner) • Take Aways • Common problems to look out for • How tools work in general • A few specific tools you can try • Where to get more information
Debugging • Typical problems • “Serial” • Invalid memory references • Array reference out of bounds • Divide by zero • Uninitialized variables • Parallel • Unmatched sends/receives • Blocking receive before corresponding send • Out of order collectives • Race conditions
Tools • printf, write • Versatile, sometimes useful • Doesn’t scale well • Not interactive • Compiler / runtime • Turn on bounds checking, exception handling • Check dereferencing of NULL pointers • Serial gdb • GNU debugger, serial, command-line interface • See “man gdb” • Parallel GUI debuggers (X-Windows) • DDT • Totalview
DDT video • http://vimeo.com/19978486 • Or http://vimeo.com/user5729706
Compiler runtime bounds checking ftn -c -g -Ktrap=fp–Mboundsflip.f90 ftn -c -g -Ktrap=fp-Mboundsprintit.f90 ftn -o flip flip.oprintit.o -g % qsub –I –qdebug –lmppwidth=48 % cd $PBS_O_WORKDIR % % aprun –n 48 ./flip 0: Subscript out of range for array put_seed (flip.f90: 50) subscript=35, lower bound=1, upper bound=34, dimension=1 0: Subscript out of range for array put_seed (flip.f90: 50) subscript=35, lower bound=1, upper bound=34, dimension=1 Out of bounds reference in source code for program “flip” … allocate(put_seed(random_size)) … bad_index = random_size+1 put_seed(bad_index) = 67
Performance Questions • How can we tell if a program is performing well? • Or isn’t? • If performance is not “good,” how can we pinpoint why? • How can we identify the causes? • What can we do about it?
Performance Metrics • Primary metric: application time • but gives little indication of efficiency • Derived measures: • rate (Ex.: messages per unit time, Flops per Second, clocks per instruction), cache utilization • Indirect measures: • speedup, parallel efficiency, scalability
Optimization Strategies • Serial • Leverage ILP on the processor • Feed the pipelines • Exploit data locality • Reuse data in cache • Parallel • Minimizing latency effects • Maximizing work vs. communication
Identifying Targets for Optimization • Sampling • Regularly interrupt the program and record where it is • Build up a statistical profile • Tracing / Instrumenting • Insert hooks into program to record and time events • Use Hardware Event Counters • Special registers count events on processor • E.g. floating point instructions • Many possible events • Only a few (~4 counters)
Typical Process • (Sometimes) Modify your code with macros, API calls, timers • Compile your code • Transform your binary for profiling/tracing with a tool • Run the transformed binary • A data file is produced • Interpret the results with a tool
Performance Tools @ NERSC • Vendor Tools: • CrayPat • Community Tools : • TAU (U. Oregon via ACTS) • PAPI (Performance Application Programming Interface) • gprof • IPM: Integrated Performance Monitoring
Introduction to CrayPat • Suite of tools to provide a wide range of performance-related information • Can be used for both sampling and tracing user codes • with or without hardware or network performance counters • Built on PAPI • Supports Fortran, C, C++, UPC, MPI, Coarray Fortran, OpenMP, Pthreads, SHMEM • Man pages • intro_craypat(1), intro_app2(1), intro_papi(1)
Using CrayPat • Access the tools • module load perftools • Build your application; keep .o files • make clean • make • Instrument application • pat_build ... a.out • Result is a new file, a.out+pat • Run instrumented application to get top time consuming routines • aprun ... a.out+pat • Result is a new file XXXXX.xf (or a directory containing .xf files) • Run pat_report on that new file; view results • pat_reportXXXXX.xf > my_profile • vi my_profile • Result is also a new file: XXXXX.ap2
Guidelines to Identify the Need for Optimization * Suggested by Cray
Apprentice Basic View Can select new (additional) data file and do a screen dump Worthless Useful Can select other views of the data Can drag the “calipers” to focus the view on portions of the run
PAPI • PAPI (Performance API) provides a standard interface for use of the performance counters in major microprocessors • Predefined actual and derived counters supported on the system • To see the list, run ‘papi_avail’ on compute node via aprun: module load perftools aprun –n 1 papi_avail • AMD native events also provided; use ‘papi_native_avail’: aprun –n 1 papi_native_avail
TAU • Tuning and Analysis Utilities • Fortran, C, C++, Java performance tool • Procedure • Insert macros • Run the program • View results with pprof • More info that gprof • E.g. per process, per thread info; supports pthreads • http://acts.nersc.gov/tau/index.html
IPM • Integrated Performance Monitoring • MPI profiling, hardware counter metrics, IO profiling (?) • IPM requires no code modification & no instrumented binary • Only a “module load ipm” before running your program on systems that support dynamic libraries • Else link with the IPM library • IPM uses hooks already in the MPI library to intercept your MPI calls and wrap them with timers and counters
IPM # host : s05601/006035314C00_AIX mpi_tasks : 32 on 2 nodes # start : 11/30/04/14:35:34 wallclock : 29.975184 sec # stop : 11/30/04/14:36:00 %comm : 27.72 # gbytes : 6.65863e-01 total gflop/sec : 2.33478e+00 total # [total] <avg> min max # wallclock 953.272 29.7897 29.6092 29.9752 # user 837.25 26.1641 25.71 26.92 # system 60.6 1.89375 1.52 2.59 # mpi 264.267 8.25834 7.73025 8.70985 # %comm 27.7234 25.8873 29.3705 # gflop/sec 2.33478 0.0729619 0.072204 0.0745817 # gbytes 0.665863 0.0208082 0.0195503 0.0237541 # PM_FPU0_CMPL 2.28827e+10 7.15084e+08 7.07373e+08 7.30171e+08 # PM_FPU1_CMPL 1.70657e+10 5.33304e+08 5.28487e+08 5.42882e+08 # PM_FPU_FMA 3.00371e+10 9.3866e+08 9.27762e+08 9.62547e+08 # PM_INST_CMPL 2.78819e+11 8.71309e+09 8.20981e+09 9.21761e+09 # PM_LD_CMPL 1.25478e+11 3.92118e+09 3.74541e+09 4.11658e+09 # PM_ST_CMPL 7.45961e+10 2.33113e+09 2.21164e+09 2.46327e+09 # PM_TLB_MISS 2.45894e+08 7.68418e+06 6.98733e+06 2.05724e+07 # PM_CYC 3.0575e+11 9.55467e+09 9.36585e+09 9.62227e+09 # [time] [calls] <%mpi> <%wall> # MPI_Send 188.386 639616 71.29 19.76 # MPI_Wait 69.5032 639616 26.30 7.29 # MPI_Irecv 6.34936 639616 2.40 0.67 # MPI_Barrier 0.0177442 32 0.01 0.00 # MPI_Reduce 0.00540609 32 0.00 0.00 # MPI_Comm_rank 0.00465156 32 0.00 0.00 # MPI_Comm_size 0.000145341 32 0.00 0.00