Download
1 / 35
350 likes | 453 Views
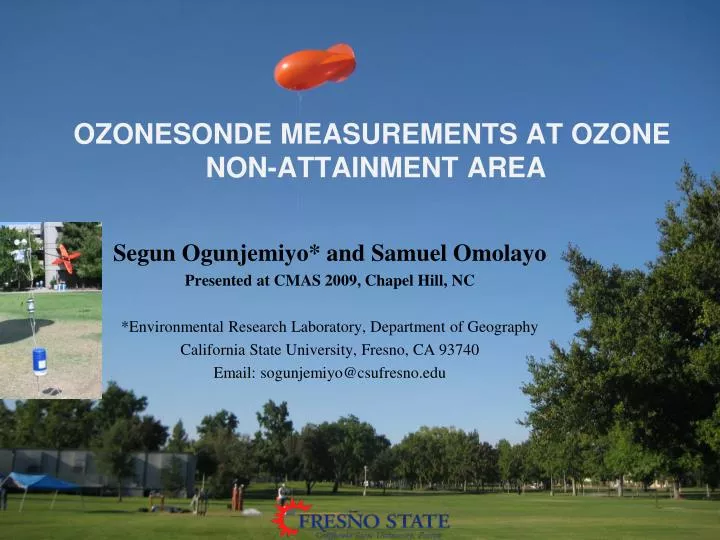
OZONESONDE MEASUREMENTS AT OZONE NON-ATTAINMENT AREA. Segun Ogunjemiyo* and Samuel Omolayo Presented at CMAS 2009, Chapel Hill, NC *Environmental Research Laboratory, Department of Geography California State University, Fresno, CA 93740 Email: sogunjemiyo@csufresno.edu. Ozone.

E N D
OZONESONDE MEASUREMENTS AT OZONE NON-ATTAINMENT AREA Segun Ogunjemiyo* and Samuel Omolayo Presented at CMAS 2009, Chapel Hill, NC *Environmental Research Laboratory, Department of Geography California State University, Fresno, CA 93740 Email: sogunjemiyo@csufresno.edu
Ozone • A triatomic oxygen molecule (O3) • occurs naturally in the stratosphere, where it absorbs and shield the surface from elevated UV radiation • a product of chemical oxidations in the troposphere , where it is a major component of photochemical smog
Why care about ground level ozone? • Causes physical injuries and physiological effects in plants • Has been linked to various health problems • Ozone can trigger asthma attacks, which occur when the airways of the lungs become inflamed and swollen
Ozone accumulation at the surface • Level is determined by the balance between the rate of photochemical production and destruction of ozone by dry deposition and titration of NOx, NO2, and other gases from surface emissions • The production is enhanced by conditions such • stagnant air • intense solar radiation • high temperature • absence of rainfall • Other factors influencing the production-destruction balance include • local sources and sinks of ozone and ozone precursors • horizontal and vertical transport (Neu et al., 1994; Kleinman et al., 1994; Fast et al., 2002; Lin et al., 2004 and 2006).
Vertical transport of ozone • The significance of downward mixing of ozone-rich air aloft to ground level ozone accumulation has been noted (e.g. McKendry et al., 1997; Zhang and Rao, 1999; Vokovich and Scarborough, 2005; Kim et al., 2007; Lin 2008) • A relationship has also been observed between ozone peak concentration at 1-2 km layer to the next day maximum ground level ozone concentration
Boundary Layer Depth and Structure Source:Stull,1990
General consensus • The entrainment of ozone in the boundary layer needs further investigation to • better improve our current knowledge of vertical ozone transport • improve existing ozone forecasting models
OZONESONDE MEASUREMENTS • Goals • to provide insight into the vertical transport of ozone • to generate data for improving air quality forecast for the study region
Study Site: North East Fresno Clovis/N. Villa
Ozone Non-Attainment Areas • Areas exceeding the 2008 8-hour ozone standard (0.075 ppm) • Includes the San Joaquin Valley of CA, which stretches across eight counties(San Joaquin, Stanislaus, Merced, Madera, Fresno, Kings, Tulare, and Kern) • Boarders by two mountains • 10% of California’s population • Two largest metropolitan area are Fresno and Bakersfield
10 Most Ozone-Polluted Cities 2007 http://lungaction.org/reports/sota07_cities.html
Fresno smog Fresno Pacific Towers -- the former Security Bank building -- looms through smog in downtown Fresno. Source: Fresno bee Clear sky tops a layer of smog over Fresno, Calif., in this August 2002 photo. A proposed rule would require builders to reduce air pollution. Source: Fresno Bee
Where does the SJV pollution come from? • A significant portion of the total air pollution is from the Bay Area • 27% in the northern portion • 11% in the central • 9 % in the southern valley Source: SJVAPCD.COM
Factors that make the San Joaquin Valley vulnerable to air pollution Topography The Sierra Nevada and Coastal ranges trap airborne pollutants near the Valley floor. Climate The Valley’s hot summer temperatures aid in the formation of harmful smog. Growing population As population levels increase, so does air pollution. More cars and more activities contribute to poor air quality.
Tethered ozonesonde • Cathode cell contains 3ml of dilute KI solution • Anode cell contains1.5 ml of a saturated KI solution. • The piston pump bubbles ambient air into the cathode cell solution, causing ozone in the air to oxidize the iodide to iodine • Electrical current generated is proportional to the amount of ozone in the air • The current is converted by the electronic interface into a digital signal compactable with the tethersonde data format Connecting the current sensor to the interface card
Electric Winch Major Winch components
Flight Summary • 9 Flight days • Jul: 07/24, 07/30, 07/31 • Aug: 08/10, 08/23 • Sep: 09/04, 09/06, 09/08, 09/13 • The number of flights varies between the days, ranging from 3 on 07/24 to 8 on 08/23 • Approval from local control tower • Prevailing weather condition (cloudy, windy conditions) • Instrument malfunctions
Variables measured • Air temperature (oC) • Relative humidity (%) • Potential temperature (oC) • Dew point (oC) • Specific humidity • Ozone concentration (ppbv) • Water mixing ratio (gm/Kg) • Wind speed (m/s) • Wind direction (degree) • Pressure (mb) • Height (m)
Final Remarks • Our data highlights the roles of the boundary layer evolution in the vertical transport of ozone • More investigations are needed to fully address the the impacts of downward mixing on surface ozone accumulation
Acknowledgements • Funding for this study was provided by NSF through the MRI Program and by the College of Social Sciences, California State University, Fresno