Download
1 / 27
270 likes | 385 Views
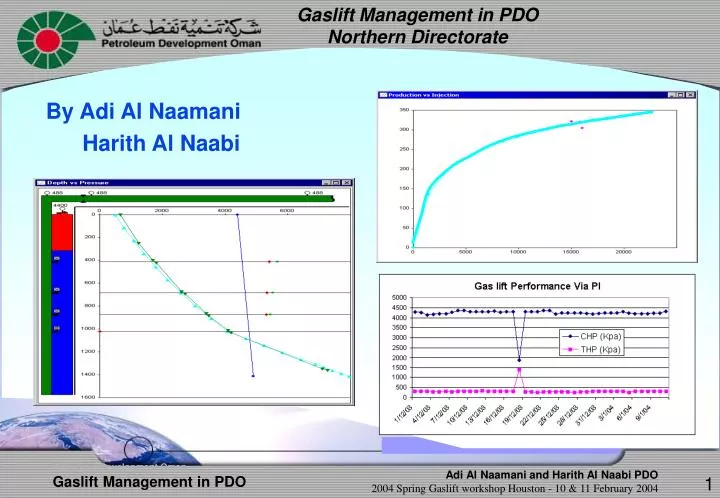
Gaslift Management in PDO Northern Directorate. By Adi Al Naamani Harith Al Naabi. 1. Gaslift Management in PDO Agenda. Introduction Designs, Improvements, Opportunities and challenges Gaslift management and processes Automatic Validation Tester (AVT) and Wireless gaslift trial

E N D
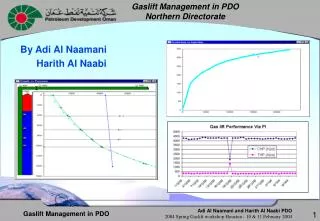
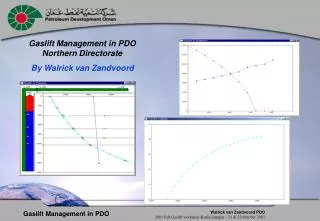
Gaslift Management in PDONorthern Directorate By Adi Al Naamani Harith Al Naabi 1
Gaslift Management in PDO Agenda • Introduction • Designs, Improvements, Opportunities and challenges • Gaslift management and processes • Automatic Validation Tester (AVT) and Wireless gaslift trial • Overview per area and examples • Conclusion 2
Location IRAQ IRAN • Country size 312,000 km2 • Population 2.3 million • Accelerated development • 75 % income depends on hydrocarbon Turkey Libya Saudi Arabia Eygpt Sudan 3
People 4
People 5
GULF OF OMAN Sohar MUSCAT Sur ARABIAN SEA 100 km Salalah Petroleum Development Oman • PDO (since ‘66) is a JV between • 60 % Government of Oman • 34 % Shell • 4 % TotalFina • 2 % Partex • Shell is technical advisor • Production 700 kb/d (90% of Oman’s Oil production) • 66 producing stations • 117 oil producing fields • Over 3000 active wells • 620 gaslift strings. 28% of production, 200,000 bbl/d • 85% of gaslift production from North • Majority of fields under water flood N S 7
The North of PDO has primarily carbonate reservoirs with depths varying from as shallow as 800m to 2700m deep. Now there are approximately 500 Gaslift wells constituting 50% of the oil producers. In the North, Gaslift wells produce 45% of the oil and 42% of the gross. Gaslift wells in the Northern Directorate 8
Design • Design in most wells has 2 to 5 mandrels, depending on well depth and expected deepest operating point • IPO valves are run in >95% of the wells • Mostly unloading valve sizes are the same as the orifice valve size. • Redesigns are done where well behaviour becomes too unstable, parameters change 9
Initial Performance Operating @ mandrel 2 (through unloading valve) Future Performance after on-stream of Water Injector Operating @ mandrel 3 (through unloading valve) Later Performance Operating @ mandrel 4 10
Optimisation and Challenges • Well by Well • Unstable wells • Leaking valves or tubing • Well integrity (e.g. leaking casing) • Possibility to lift deeper • Scale clean outs • Group optimisation • Surface controlled gaslift rates through SCADA / DCS • Set-points based on optimal distribution of liftgas using WinGLUE • Deferment reduction through re-distribution of liftgas 11
Optimisation and Challenges • Challenges w.r.t. optimal distribution of liftgas • Measurements (especially gas) are of insufficient quality. Flowing surveys are therefore essential • Well integrity problems has Impact on well models • Continuous changes in the reservoir pressure, PI, water cut etc. • The dynamics of reservoir not captured in well models. • Young & bright, but in-experienced production engineers. • Solutions • Dedicated production engineers on well integrity • Surveillance engineers responsible for only 50 - 70 wells in total • Intensive training and bringing in coaches 12
Process • Dedicated gaslift process • Monitor and trouble shoot using SCADA and test data • Understand the problem and correct • Further investigation • Analyse results of investigation • Determine improvement potential, costs and justify activity. • Design new gaslift string and schedule activity • Set valves, test valves before running & test retrieved valves with AVT tester and feedback • Kick off the well and evaluate the results • Review and file report 13
PDO Gaslift Management Set-up Tubing pressure Casing pressure SCADA SGAS-CAO Direct monitoring & Control of Individual Wells Gaslift Control Gaslift Metering DCS Controls Gaslift rates to the wells Well Data WinGLUE Gaslift optimisation Software Reservoir Data Production Data 14
Process Improvements • WinGLUE gaslift QC database set up • Automated links • Central storage of gaslift analyses • Most wells available in the SCADA system (RTAP / SOFS or the latest PC based FIELDWARE). • AVT tester is used for QC valves before running and recently pulled valves 15
Decker’s Automatic Validation Tester (AVT ) • Implemented in the well services workshop • TROP, stem travel, R ratio etc. • Rejected at agreed tolerances, e.g. TROP difference < 15 PSI • >25% of the valves were rejected on TROP. • Visible improvements • Testing of pulled valves just started. >60% fail on leaking bellows. • Keep track of a “problem log” to increase understanding • Network connection is essential • Staff in the well services more conscious 16
Specific Overview per AreaArea A • Constrained due to flaring restriction (no compressor ullage) • Workshop was organised • Deliverables of the workshop: • Coaching / training • Saving of 3.6 million scf/d of liftgas • Well integrity problems found and repaired • Detailed gaslift surveillance was carried out and many wells were stabilised • Many gaslift measurements wrong and corrected • For 2003 the estimated impact on production is approximately around 1200 bbl/d. 17 L
In Area B, test data quality is an issue Some wells were found quit Some wells found with scale obstruction. Cleaned out and restored. Total increase in the Area B was 600 bbl/d or 10% of the total gaslift production. 3% 2002 & 2003 year average impact. Specific Overview per AreaArea B 18 Q
Example of importance of F/S Well was tested 2000 bbl/d net oil, low BSW through 3 1/2” 200 bbl/d gain from switching on gaslift Theoretical pressures Tubing upsize was expected to double production Flowing survey could only be matched with 1200 bbl/d and tubing upsize was canceled Actual pressures 19
Area C consists of two large fields Field N has mostly natural producers. Flow limited by Gas Oil Gravity Drainage (GOGD) N compressors are full. Cutting back liftgas investigated. Field C is partly water-flood and partly GOGD Workshop held. Opportunities found: Reduce liftgas consumption to free up compressor space (cutting back lift-gas, running velocity strings, 3 1/2” to 2 7/8” tubing) Some wells without RTU’s Specific Overview per AreaArea C 20 F
Wireless Gaslift Valves Trial Area C • Wireless gaslift valves (2) were installed in a well in Field C in 2002. • Communication through a modem with PC in CCR and Main Office • Down-hole pressures and temperatures displayed • Full control from the desktop was achieved • Live optimisation • Modem on bottom valve broke down, but still operating. • Confirmed bad batch of modems (50%) 21 F
Wireless Gaslift Valves Trial Area C • Business case for large scale implementation being made, but • 15 - 20 times higher costs than conventional gaslift • Even with one third of costs, large scale implementation means 16,000 bbl/d extra production is required or 8% of production. • Most promising to replace PPO valves & IPO running it as part of new well or existing well work-overs. 22 F
Specific Overview per AreaArea D • Advanced automation; surface control valves linked to the DCS & SCADA. Full control and optimisation. • Main challenge is well integrity and continuously changing well performance. • Additional people have been put on the job in Area D (surveillance engineers). They complement the work of the other production engineers. • Coaches brought in 23 Y
Specific Overview per AreaArea D - Well Examples 5000 4500 4000 3500 3000 2500 700 2000 600 1500 1000 500 500 400 0 25-Apr 25-Apr 25-Apr 25-Apr 25-Apr 25-Apr 25-Apr 300 Tubing Pressure Casing Pressure 200 100 0 6000 Apr-03 Apr-03 Apr-03 Apr-03 Apr-03 Mar-03 Mar-03 May-03 May-03 May-03 5000 4000 Gross m3/d Net m3/d Gas Lift x 100 m3/d 3000 2000 1000 0 28-May 28-May 28-May 28-May 28-May 28-May 28-May 28-May Tubing Pressure Casing Pressure Surging pressure before Optimisation Maintain Production with 50% less Liftgas Stable operation after Optimisation 24Y
Specific Overview per AreaArea D - Well Examples 7000 6000 5000 4000 500 3000 450 400 2000 350 1000 300 250 0 200 22-Sep 22-Sep 22-Sep 22-Sep 22-Sep 22-Sep 22-Sep 22-Sep 150 Tubing Pressure Casing Pressure 100 50 5000 0 4500 Jan-03 Jan-03 Jan-03 Jan-03 Jan-03 Apr-03 Mar-03 Mar-03 Mar-03 Mar-03 Feb-03 Feb-03 Feb-03 Feb-03 4000 3500 Gross m3/d Net m3/d Gas Lift x 100 m3/d 3000 2500 2000 1500 1000 500 0 28-May 28-May 28-May 28-May 28-May 28-May 28-May 28-May Tubing Pressure Casing Pressure Surging pressure before Optimisation Production increase of 350%. Stable operation after Optimisation 25 Y
Reduction in Liftgas usage (~36 mln scf/d) Cost savings on Gaslift compressor requirements. Enabled production of high GOR wells Create compressor capacity to handle new oil producers. Stabilising wells, Reduce flaring In some cases lifting deeper Sum of the measurable initial production increases after activities in 2003 is around 4500 bbl/d (2% of total North) Year average value is 0.7%. Conclusion 26
Further enhance staff competence and skills Complete implementation of the AVT tester Trial new technology such as Bubble breaker, Bubble gaslift and surface controlled gaslift valves Bringing in a dedicated production engineer for gaslift Continue with the efforts, because it pays back. What is happening next …..? 27