Download
1 / 34
340 likes | 507 Views
Evaluation of FTA Drug Abuse Testing Program April 2011. Jerry Powers, FTA Office of Program Management – Safety & Security. Evaluation Analysis Opportunities. Use DAMIS data and external cost measures to develop a cost benefit model

E N D
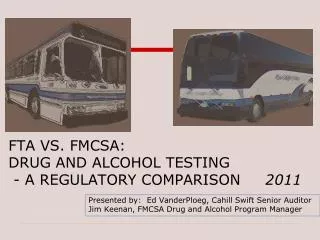
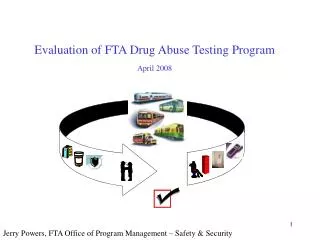
Evaluation of FTA Drug Abuse Testing ProgramApril 2011 Jerry Powers, FTA Office of Program Management – Safety & Security
Evaluation Analysis Opportunities • Use DAMIS data and external cost measures to develop a cost benefit model • Compare DAMIS data to SAMIS data to determine safety benefit from the D&A Program • Raise the bar – provide customer service. Opportunities to use DAMIS to help agencies justify D&A expenditure apart from it just being a regulatory requirement • Show where to focus efforts/funding - areas for improvement
CHARTERProve the Effectiveness of the D&A Program in Achieving FTA Strategic Goal • Promoting public safety by eliminating transit-related deaths, injuries, and property damage USE: • Maturing DAMIS data together with: • Safety Data (SAMIS/NTD) • Audits/Technical assistance experience and data • Other Industry and Government D&A measures • Creative analysis
New Measures of Cost and Safety BenefitsMoney, Lives & Mayhem Cost Benefit • Show cost saving to Transit Industry due to elimination or mitigation of D&A using employees • Second chance programs have significant cost benefit to industry • Audits are having a positive effect in terms of safety benefits and cost savings • Use baseline rate (1995 or 1996) and subsequent improvement to prove reduction in accidents, fatalities and injuries Safety Benefit
Outline • Concept and Measures • FTA and Testing Costs • Benefits • Mitigation of Drug & Alcohol positives • Pre-employment • Random • Reasonable Suspicion • Refusals • Post-Accident • Deterrent Effect • Safety • Audits • Second Chance Programs
D&A Evaluation Concept I. COST BENEFIT II. SAFETY BENEFIT Baseline Baseline NTD S&S Data DAMIS Data NTD S&S Data Other Industry and Government D&A Cost Measures DAMIS Data Analysis Analysis Merge these baselines into cost benefit spreadsheet Of D&A Program NTD S&S Data NTD S&S Data Merge these baselines to show D&A contributing to accident avoidance DAMIS Data DAMIS Data Other Industry and Government D&A Cost Measures
DAMIS Baseline • Random Positives are on the decline • CDL positive rate is higher than other employee categories
NTD S&S Baseline • Transit Industry is getting safer. Incidents, injuries and fatalities are trending down
I. Cost Methodology - Cost Benefit Spreadsheet . . . . . . . . . . . .
Cost Methodology – Unit of Measurement • Each D&A using employee costs the Transit Industry and the overall society $15-25K per year: • Health Care Expenditures • D&A abuse services • Medical consequences • Productivity Effects • Premature Death • Impaired productivity • Institutionalization, Incarceration, Crime careers and victims • Other Effects • Crime effects • Vehicle crashes and fire • D&A Program eliminates or mitigates users at $15-25K per user per year
2008 $2,200,000 FTA Total Cost per Year - FY2001 281,598 Total Tests 96,733 Total Random and Reasonable Suspicion Drug Tests $66.56 Cost per Test - from 1999 Rural $18,743,163 Actual Cost of Tests $6.08 Safety Sensitive Employee Productivity Cost (per test) $587,653 Total National Productivity Cost to Agencies Cost of Drug & Alcohol Program Personnel at Transit Agencies (per $40.97 Test) $11,537,070 Total National Administrative Cost to Agencies $33,067,886 Total Cost Costs • Costs have ranged from $22M-$37M per year since 1995
Savings Methodology • Transit is 0.16% of the US Gross National Product (approximately $23.4 Billion/year in 2008) • Cost of Drug use and Alcohol misuse to the US economy is $559 Billion per year – NIDA measure indexed • Transit portion of that cost is $910 Million per year. Safety-sensitive are 77% of transit employees. Thus incur $701 Million of that cost. • 10.6% of Transportation Workers with drug use and/or alcohol misuse - Substance Abuse and Mental Health Services Administration (SAMHSA) Survey • Approximately 277,500 safety-sensitive transit employees • Thus, ~29,500 incur the $701 Million in annual cost • $701,000,000/29,500 employees = $23,800 per year per employee in 2008 • Deterring or mitigating those 29,500 employees is the basic savings opportunity
Impact of Drug and Alcohol Abuse on Transit 2005 2006 2007 2008 $12,421,900,000,000 $13,398,900,000,000 Gross Domestic Product (GDP) $14,061,800,000,000 $14,369,100,000,000 Transit as a Percent of Total U.S. Economy 0.140% 0.169% 0.171% 0.163% Transit Gross Product $22,600,000,000 $24,000,000,000 $23,400,000,000 $17,400,000,000 2.19% Percent GDP change 6.30% 7.87% 4.95% $482,965,768,093 Annual Economic Cost of U.S. Drug & Alcohol Abuse $520,951,708,683 $546,725,383,215 $558,673,264,017 Annual U.S. Total Societal Economic Cost of Drug & Alcohol Abuse $676,515,216 $878,692,177 $909,796,325 $933,124,436 (Transit Portion) Annual Economic Impact of Each Drug and Alcohol Using Employee 2005 2006 2007 2008 Total Transit Safety-Sensitive Employees 260,045 266,239 273,158 277,540 Total Transit Employees 323,108 329,355 350,004 360,822 Percent of Safety-Sensitive Transit Employees 80.5% 80.8% 78.0% 76.9% Percent of Drug Use and/or Alcohol Misuse among Transportation Workers 10.60% 10.60% 10.60% 10.60% Current Drug Using and/or Alcohol Misusing Safety-Sensitive Transit Workers (Extrapolated using 10.6%) 27,565 28,221 28,955 29,419 Average Annual Economic Impact of Each Drug Using and/or Alcohol Misusing Transit Employee $19,753 $25,169 $25,151 $23,787 Savings Methodology
Pre-employment 2005 2006 2007 2008 Pre-employment Drug Tests - Yields Unique Safety-Sensitive Applicants 76,918 87,215 94,465 89,015 Pre-employment Drug and Alcohol Tests 87,276 99,931 107,910 104,131 Unique Applicants with a Drug or Alcohol Pre-employment Positive 1,698 2,072 2,240 1,795 Pre-employment Positive Rate 2. 21% 2.38% 2.37% 2.02% Eliminated from Employment Consideration by Positive Pre-employment 18,125 20,197 22,437 24,232 Test (Cumulative 1995-2005) Annual Societal Economic Cost Avoided by Transit Industry due to • Eliminating Users from Employment Consideration as a Result of $358,015,647 $508,339,081 $564,320,046 $576,414,058 • Positive Pre-employment Tests (Using Cumulative Figure) Cost MethodologyPre-employment Savings • Pre-employment testing - eliminated 24,232 users over the course of the Program. These users would have cost the Transit Industry $576 Million in 2008 (24,232*$23,787 = ~$576,000,000).
Random 2005 2006 2007 2008 Percent of Random Test Positive (Drug) 0.71% 0.69% 0.71% 0.74% Random Test Positives (Drug & Alcohol) - Users Eliminated or Mitigated 1027 1000 732 756 from Transit Workforce Random Test Positives (Drug & Alcohol) - Users Eliminated or Mitigated 5701 5607 5123 4672 from Workforce (Cumulative 5-year Rolling) 991 970 689 715 Random Drug Test Positives - Users Eliminated /Mitigated from Workforce 40,522 Total Alcohol Screens 40,826 38,477 40,221 Random Alcohol Screen Positives - Eliminated or Mitigated in Workforce 36 30 43 41 Percent of Random Screen Positive (Alcohol) 0.09% 0.07% 0.11% 0.10% Annual Societal Economic Cost Avoided by Transit Industry due to Eliminating or Mitigating Users as a Result of Positive Random Tests $112,609,501 $141,122,802 $128,850,185 $111,134,305 (Using Cumulative Figure) Cost MethodologyRandom Savings • Random testing - eliminated or mitigated 4,672 users over the previous 5 years of the program in 2008. These users would have cost the Transit Industry $111 Million in 2008 (4,672*$23,787 = ~$111,000,000).
Cost MethodologyPost-Accident, Reasonable Suspicion, and Refusals • Post Accident positives - eliminated or mitigated 956 users over previous 5 years in 2008. These users would have cost the Transit Industry $23 Million in 2008. • Reasonable Suspicion - eliminated or mitigated 625 over previous 5 years in 2008. These users would have cost the Transit Industry $15 Million in 2008. • Refusals - eliminated 1,724 users over previous 5 years in 2008. These users would have cost the Transit Industry $41 Million in 2008.
Deterrent Effect of Random Testing Year to Year calculation – no cumulative effect If the positive rate remained the same as at the beginning of the program, each year there would be ~2000 more positives per year Random Positive Rate
Deterrant Effect Baseline Rates 1996 1998 2000 2002 2003 2004 2005 2006 2007 2008 Percent of Random Test Positive (Drug) 1.73% 1.50% 1.07% 0.95% 0.89% 0.87% 0.80% 0.71% 0.69% 0.71% 0.74% Percent of Random Screen Positive (Alcohol) 0.17% 0.16% 0.13% 0.10% 0.10% 0.09% 0.08% 0.09% 0.07% 0.11% 0.10% Employees Abstaining from Using Drugs due to the Program (Current % Positive Subtracted from Baseline % Positive) N/A 491 1483 1948 2195 2194 2429 2652 2769 2786 2748 Annual Societal Economic Cost Avoided by Transit Industry due to Workers Abstaining because of FTA RandomDrug Tests N/A $8,573,707 $28,656,441 $31,808,655 $38,698,225 $41,048,946 $49,601,804 $52,392,928 $69,690,190 $70,076,885 $65,359,103 Employees Abstaining from Misusing Alcohol due to the Program (Current % Positive Subtractedfrom Baseline % Positive) N/A 22 91 172 188 214 238 215 261 163 193 Annual Societal Economic Cost Avoided by Transit Industry due to Workers Abstaining because of Random Alcohol Screens N/A $380,048 $1,755,938 $2,816,154 $3,308,427 $4,010,991 $4,850,420 $4,245,373 $6,567,505 $4,104,007 $4,591,901 Deterrence – Random Program • Has saved a total of $593Million 1995-2008 • From $9M to up to $76M per year
Cost Methodology • Drug and Alcohol Rules Cost Benefit (Regulatory Impact Analysis) called for a $1.39 Billion benefit over 10 years. An average of $139 million/year. • Real data from the first 14 years blows this figure away • $5.072 Billion (or $362 million per year average) Redskins 27 Cowboys 14 It’s Up and…. It’s Good!
Safety Methodology - D&A Accidents are Comparable with Regular Accidents in Lethality • SAMIS shows and .0071 fatalities per Accident (Collision) 1995 – 1998. • DAMIS shows .0077 fatalities per D&A Accident. • Thus, D&A has comparable lethality to Overall Safety figures in fatal accidents (8% higher than non-D&A accidents). • Fatalities are a function of accidents – bad luck when they occur
Safety Methodology - Show that D&A Program Saves Lives and Reduces Injuries • D&A Program Reduces Accidents and thus, exposure to Injuries and Fatalities • No way of measuring the D&A related accident rate before the program, so… • Use 1995 as a baseline
Saving Lives: It’s What’s above the Curve Post-Accident Positive Rate (Drug and Alcohol) Per Incident • Using 1995 as a baseline, • the dark wedge represents: • 2326Accidents • 18 Fatalities • 2044Injuries Post Accident Positive Rate
Safety Methodology -Less Accidents = Less Mayhem • DAMIS showed that 3.1% accidents were D&A related in 1995 (Baseline) • DAMIS showed that 1.4% accidents were D&A related in 2008 (Improvement) • If the rate had remained at 3.1%, 2326 more accidents would have resulted from 1996-2008. • National Transit Database (NTD) Safety & Security module reveals that .0071 fatalities result per accident (collisions, vehicle going off road, and derailments) • At an overall DAMIS rate of .0077 fatalities per accident, these 2326 accidents would be expected to cause 17.91 fatalities.
The FTA Drug & Alcohol Testing Program The decrease in illicit drug use in the transit industry has resulted in the positive rate dropping from 1.76% to 0.82% resulting in: • An avoidance of 2,326 accidents that would have produced approximately 18 fatalities and 2,044 injuries. • The elimination or mitigation through rehabilitation of 27,690 illicit drug users in the transit industry through both testing and deterrence • 3. Productivity benefits and total societal economic cost avoidance of $4.60 billion dollars
Training Cost for New Employees • Transit employee salary – weighted average from 2000 Bureau of Labor Statistics
Cost Measures - Is Return-to-duty and Follow-up a Benefit or a Burden? • It is estimated that to train new employee, it costs 1/3rd of an employee’s annual salary • $1650 per month – D&A Using employee D&A Abusing Employee Costs Training Costs for New Employees
Second Chance Programs Return to Duty and Follow-up totals 29,755 Return-to-Duty Tests (Both Drugs & Alcohol) 209,033 Follow-up Tests (Both Drugs & Alcohol) 527 Positives - Failed Return-to-Duty Tests (Both Drugs & Alcohol) 2347 Positives - Failed Follow-up Tests (Both Drugs & Alcohol) 9.08% Percent Positives per Return-to-Duty Employee 1995-2008 7.03 Follow-up tests per RTD employee 1995-2005 Average Transit Salary - 2000 $259,583,768 Savings through the Avoidance of Training Costs Societal Economic Cost of Employing a Drug User or Alcohol Misuser (2 months or 1/6 of Average Annual Economic Impact of Each Drug & Alcohol Using Transit Employee) $9,096,536 Cost of Additional Testing - Return-to-Duty and Follow-up (assume $70/test because of Urban focus) $16,715,160 $28,564,800 Substance Abuse Professional (SAP) Cost (assume $960/ RTD Emp.) $205,207,273 Net (Savings minus Costs) - Second Chance Programs Is Second Chance Policy Beneficial to Industry? YES $28,970.32 • Benefit is almost 5 times more than the cost ($260M saved in training vs. $54M in costs), or for every dollar spent on Second Chance, industry got almost $5 dollars back.
Cost Measures - Audits • Expect a hump in Random positive rate after audit as testing gets better – random becomes more random. • And systems are generally brought into compliance • Good examples: Los Angeles, San Jose, Santa Fe OR • Random rate decreases as agency relaxes after audit OR • They go up the year of as agency readies for the audit
Audits • Expected result of Audits - Timeline Goes up as result of better testing (catch more users) Audit Lower as result of eliminating abusers and causing abstinence
Actual Audit Effect • Drop in the right of the chart shows that audits are effective in discouraging and eliminating substance abusers • Audit cost is ~$25K. One user mitigated over one year saves ~$23K
Trends: Drug Metabolization Time and Positive Rates shows Actual Drug Choices • Program would seem to be pushing users away from THC (45 days to leave the system) and towards Cocaine (3 days to leave the system) • Expect that tests catch actual THC users at a rate 15 times higher than that of actual Cocaine users • Multiplying Cocaine rate by 15 gives equivalent actual comparable usage rate • Data shows that Cocaine use is 10 to 12 times higher than THC use
Actual Usage Comparison If Cocaine was testable out to 45 days – the chart would look like This.
Questions & Answers Jerry Powers will be available for questions immediately following this presentation Room 209-210