Download
1 / 1
10 likes | 161 Views
Supplementary Figure 1. a. b. p =0.0002. p <0.0001 r =0.9529. mRNA level as % relative to GAPDH (log2) in qRT-PCR. Microarray expression values. Supplementary Figure 1, Quantitative RT-PCR for VCAN expression

E N D
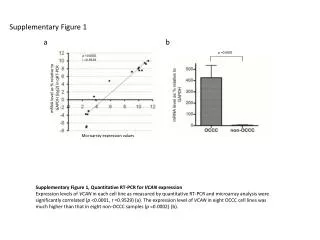
Supplementary Figure 1 a b p =0.0002 p <0.0001 r =0.9529 mRNA level as % relative to GAPDH (log2) in qRT-PCR Microarray expression values Supplementary Figure 1, Quantitative RT-PCR for VCAN expression Expression levels of VCAN in each cell line as measured by quantitative RT-PCR and microarray analysis were significantly correlated (p <0.0001, r =0.9529) (a). The expression level of VCAN in eight OCCC cell lines was much higher than that in eight non-OCCC samples (p =0.0002) (b).


